Explore the App Center
Explore our StrataQuest Apps and discover a wide range of biomedical image analysis solutions to inspire your research. If you don’t find the perfect fit for your needs, reach out to us — Our team of application experts are happy to support you by developing custom Apps tailored to your unique analysis requirements.
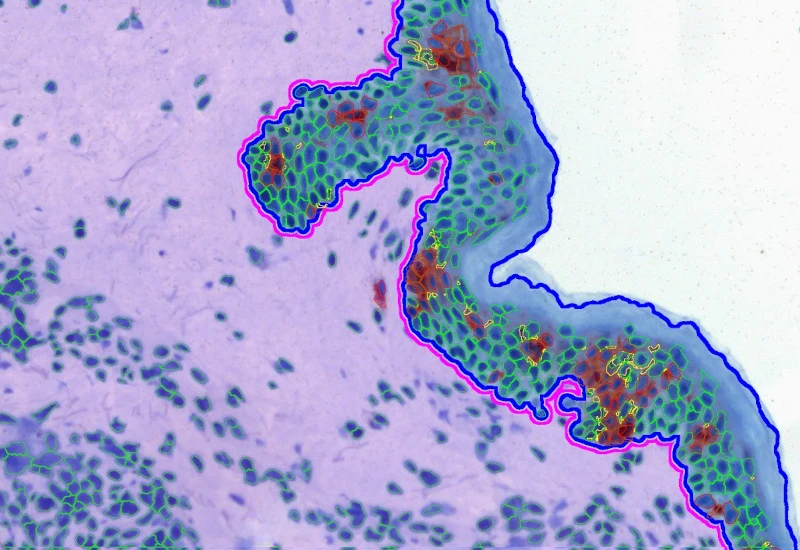
IF Artificial Skin
Stratify skin equivalents into dermis and epidermis, segment the stratum corneum, high/low suprabasal and basal layers, and quantify staining intensity, area, nuclei, and number/% of marker-positive cells for each layer.
dermatology, epidermis, dermis, skin, aging, oxidative UV damage, artificial skin

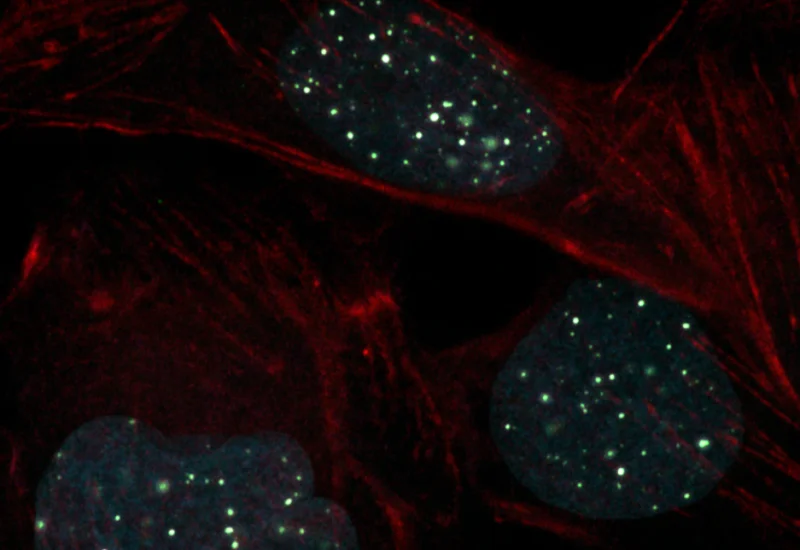
IF Cardio Cell Culture Dots
Segment cultured cardiac cells, detect cardiomyocytes and fibroblasts, and quantify dot markers (CISH/FISH) per cell, including cell counts and dot number, area, and mean intensity.
cardiology, cardiomyocytes, cell culture, fibroblasts, troponin red, FISH
IF Brain App
Classify brain regions using an AI-based classifier and detect cellular phenotypes (e.g., astrocytes) based on markers, quantify tissue areas, total cells, and phenotype counts across regions.
brain, mouse, astrocytes, machine learning
IF 4
Analyze single-cell co-expression of four IF markers, segment cells into nucleus, perinuclear area, and/or cytoplasm, and export up to 20 intensity, statistic, and morphometric parameters.
co-expression, phenotyping, fluorescence, epithelial cells, immune cells
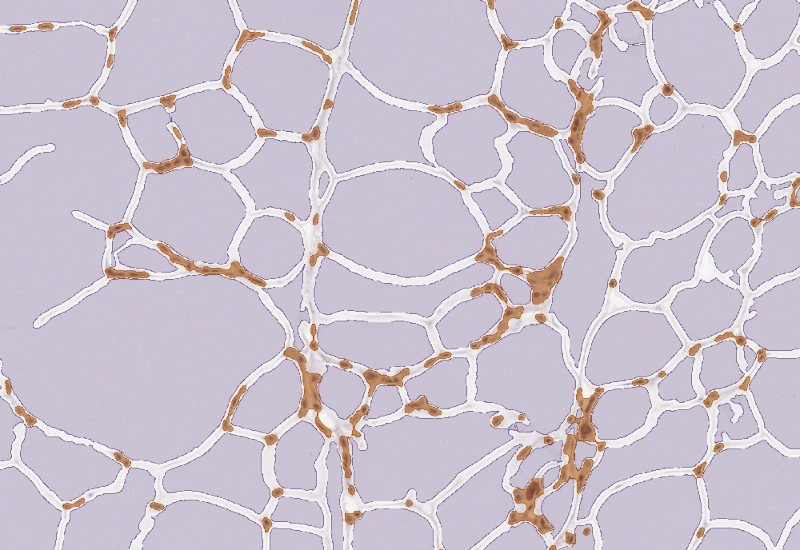
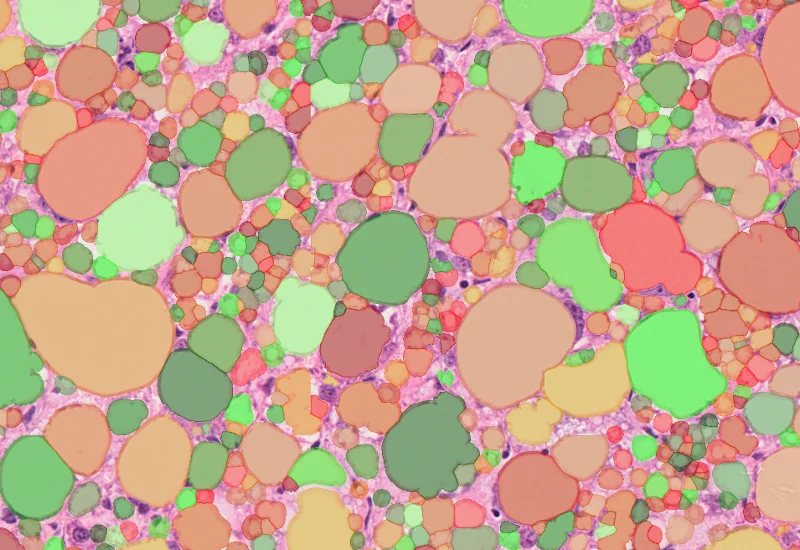
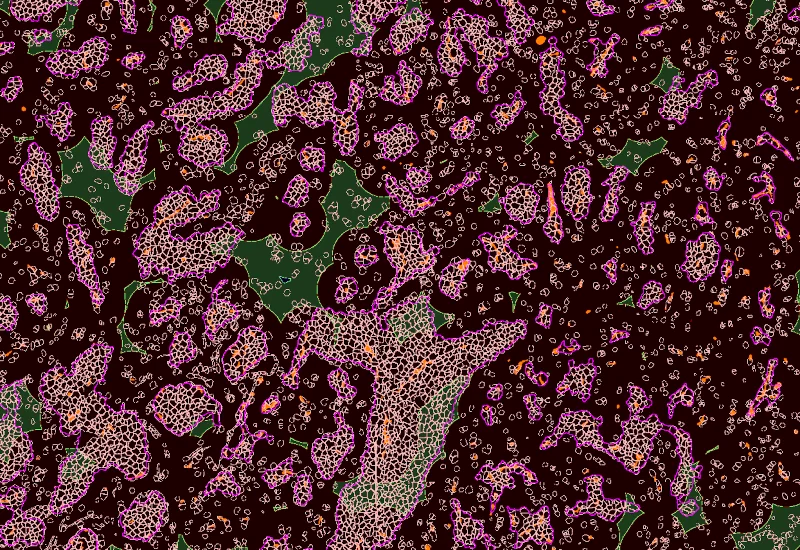
IHC Adipocytes+
The IHC Adipocytes+ App detects adipocytes and cellular aggregates between them. Outputs include number and area measurements for adipocytes and aggregates.
adipocytes, fat tissue, fat cells, immunohistochemistry, immune cell detection
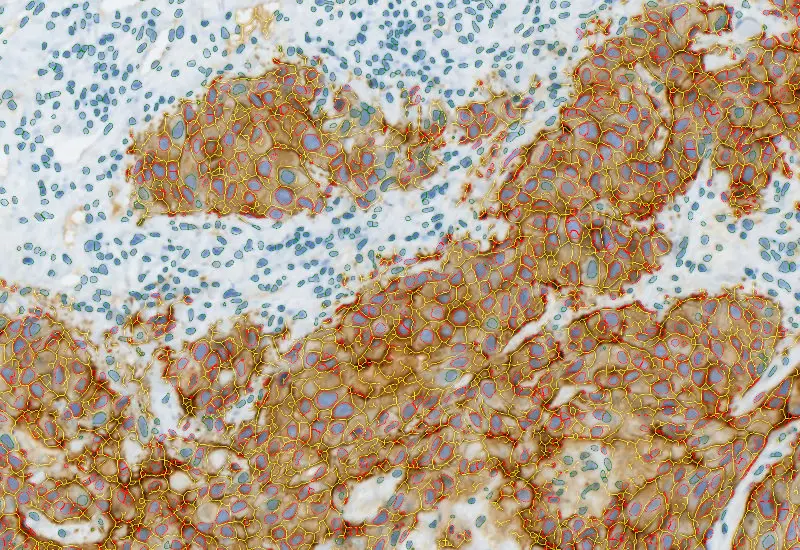
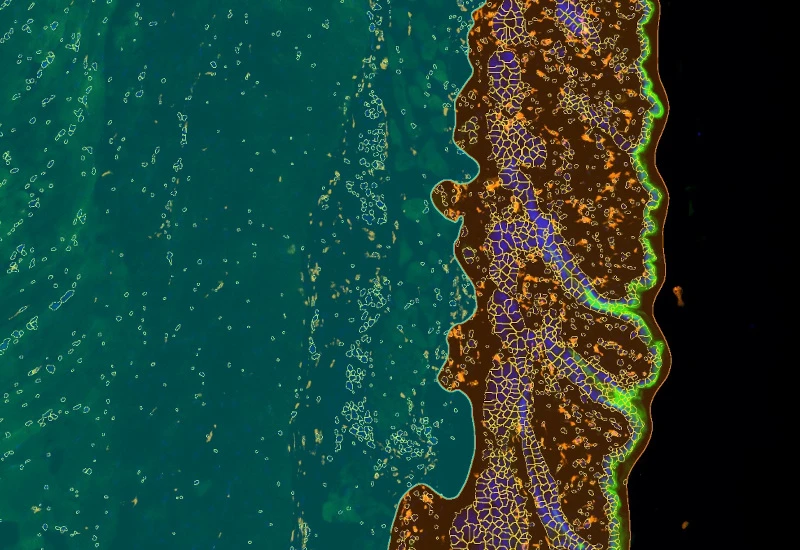
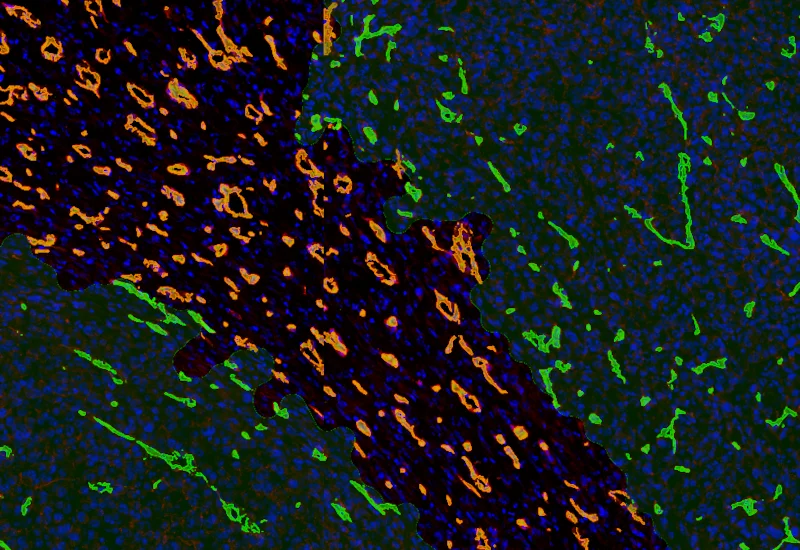
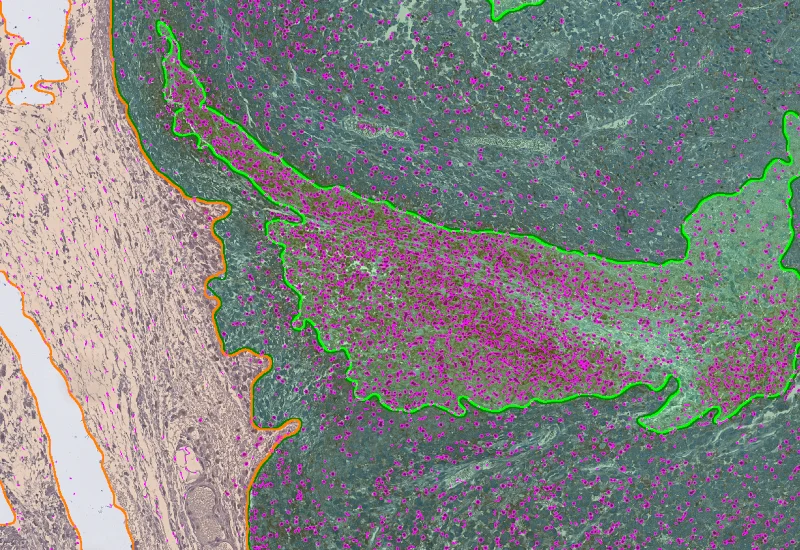
IHC Lung Cancer Mouse
Segment murine lung sections into tumor and non-cancerous tissue using a machine learning classifier, detect hematoxylin-stained nuclei, and quantify tumor area and marker-positive cellular phenotypes.
immunohistochemistry, lung cancer, tumor microenvironment, mouse, lung
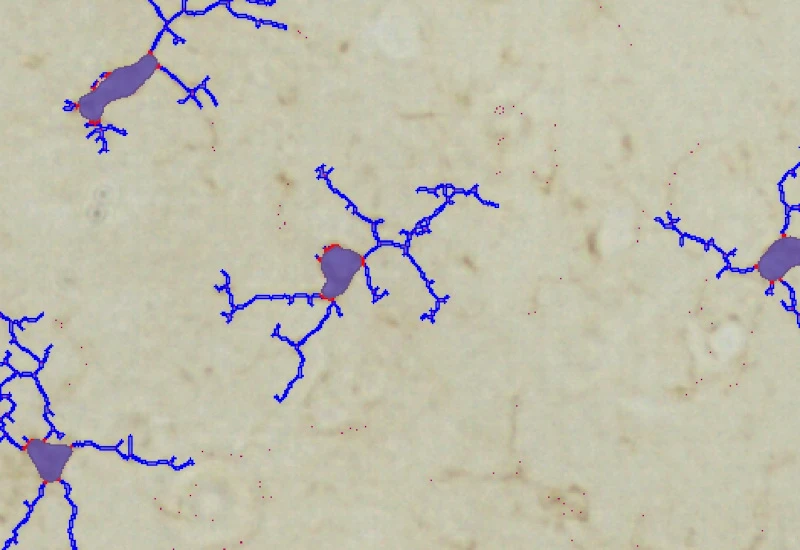
IHC Microglia
Detect microglia soma in IHC-stained samples, segment branches, and identify primary and secondary branching points to quantify cell morphology and branching complexity.
microglia, central nervous system, peripheral nervous system, phagocytosis, astrocytes, branches
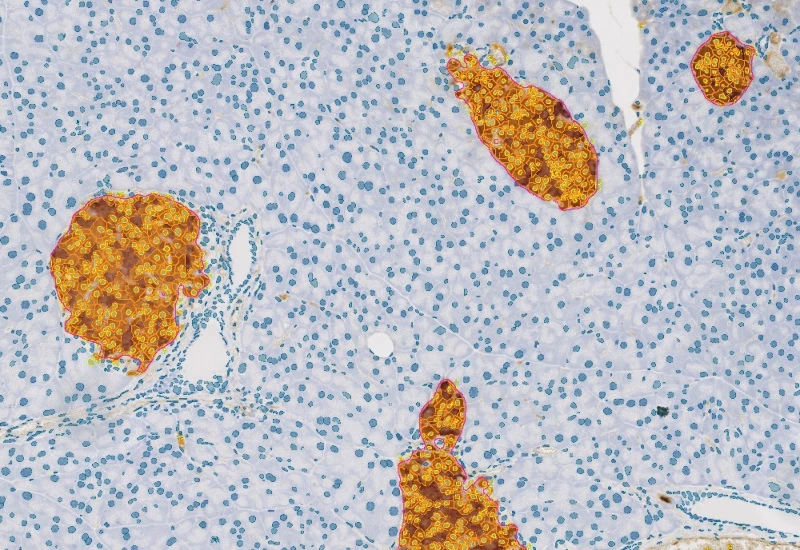
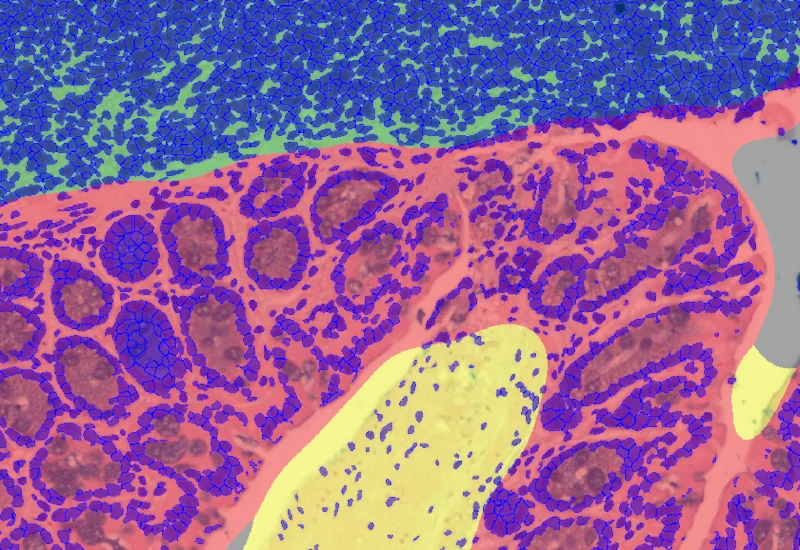
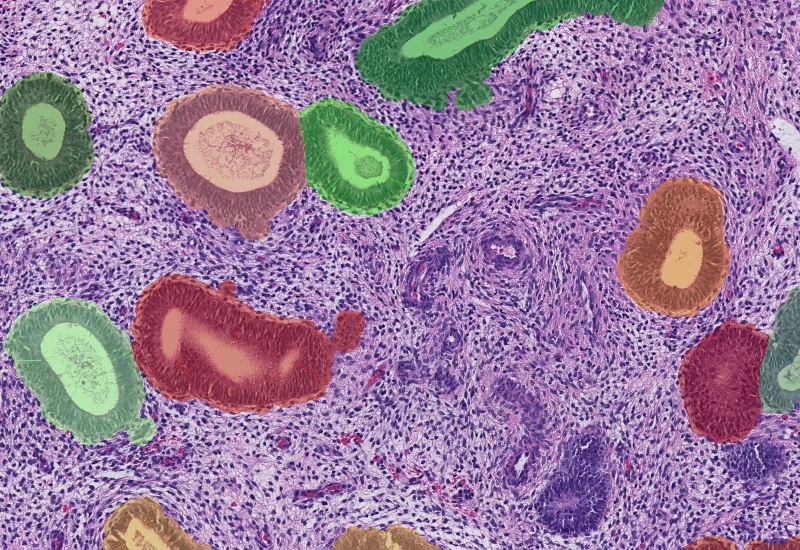
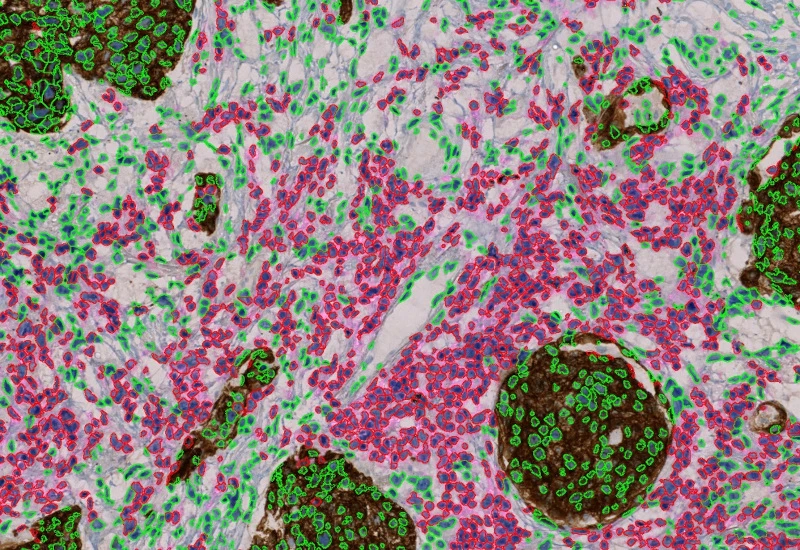
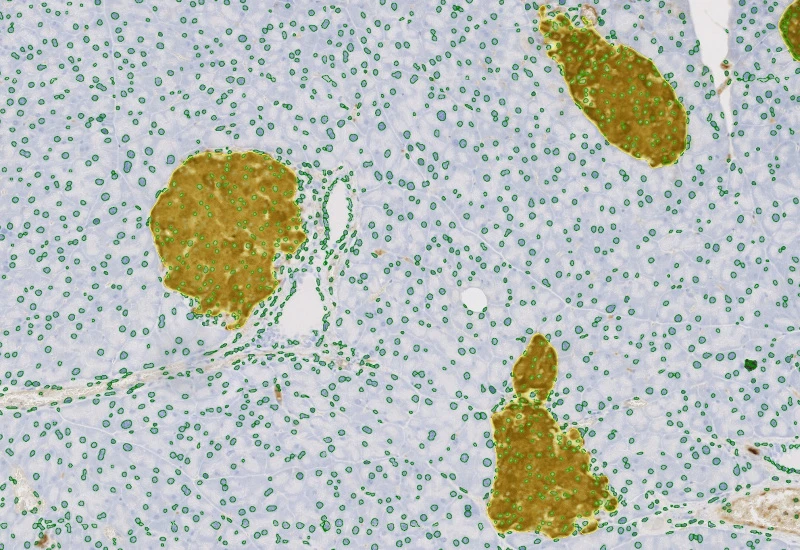
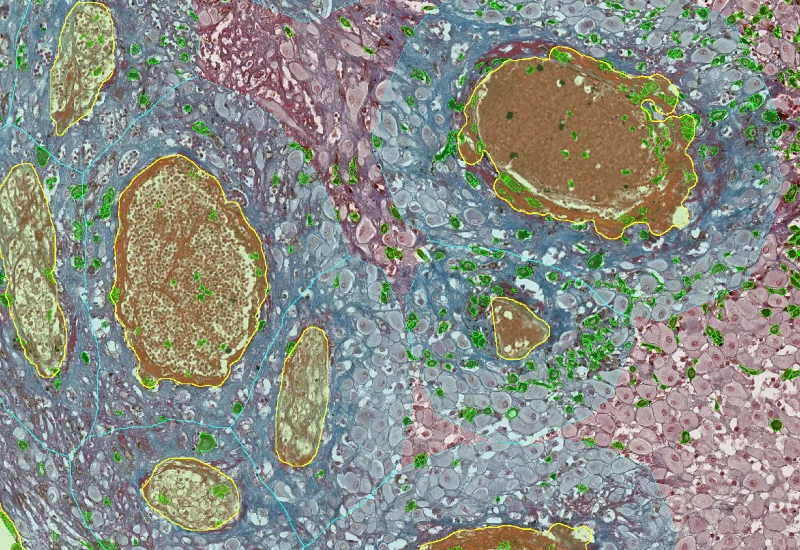
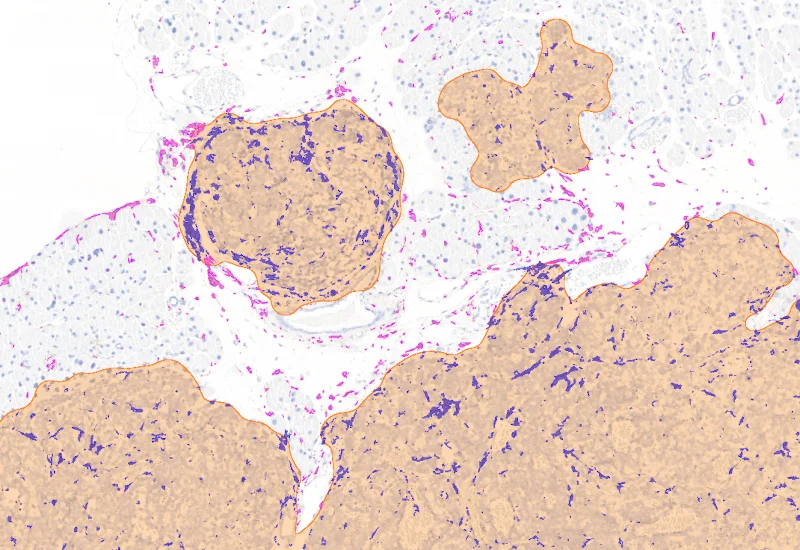
IHC Insulin Islets
The IHC Insulin Islet App detects marker-stained insulin islets, tissue area, and cell phenotypes within and outside the islets. Outputs include tissue and islet area, cell counts, and phenotype distribution.
insulin islets, pancreas, beta-cells
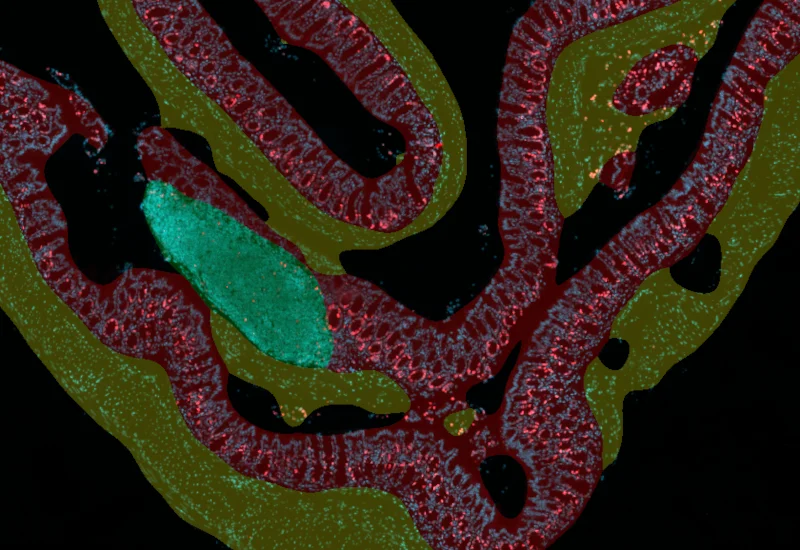
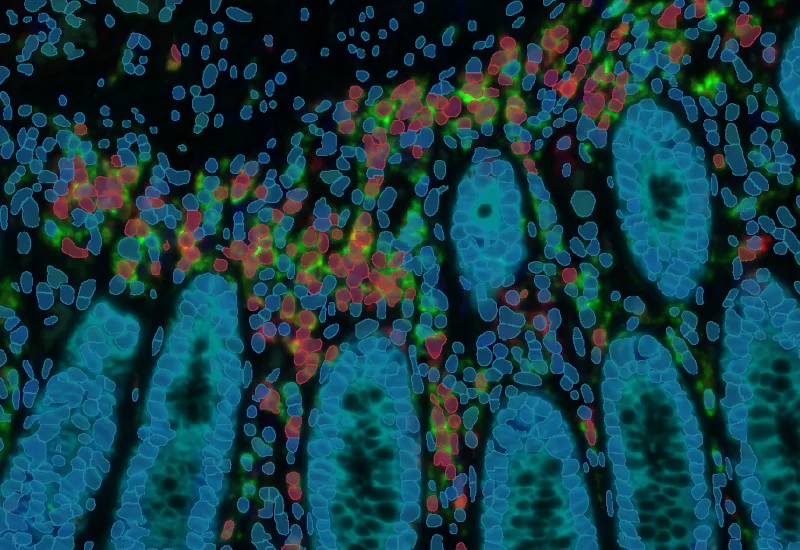
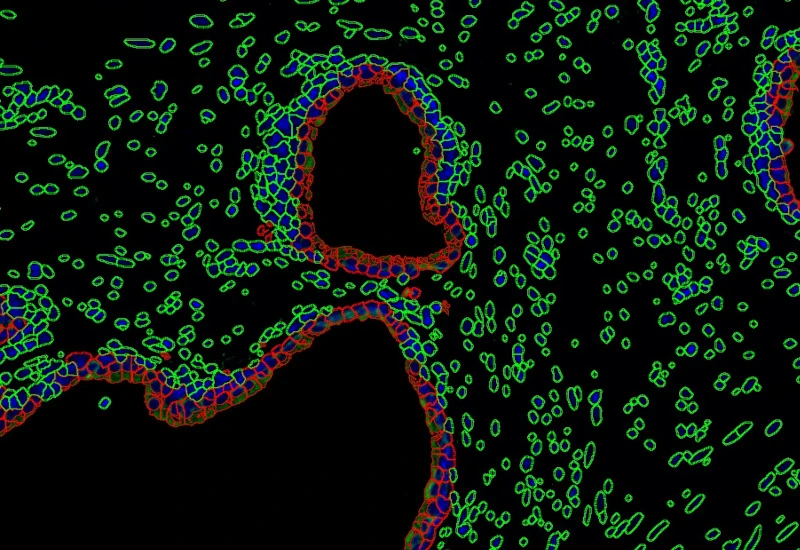
IF Swiss Roll
The IF Swiss Roll App segments tissue into subclasses (e.g., mucosa, follicles, connective tissue), detects nuclei, and identifies phenotypes via IF stains.
mouse, colon, fluorescence, immune cell follicles
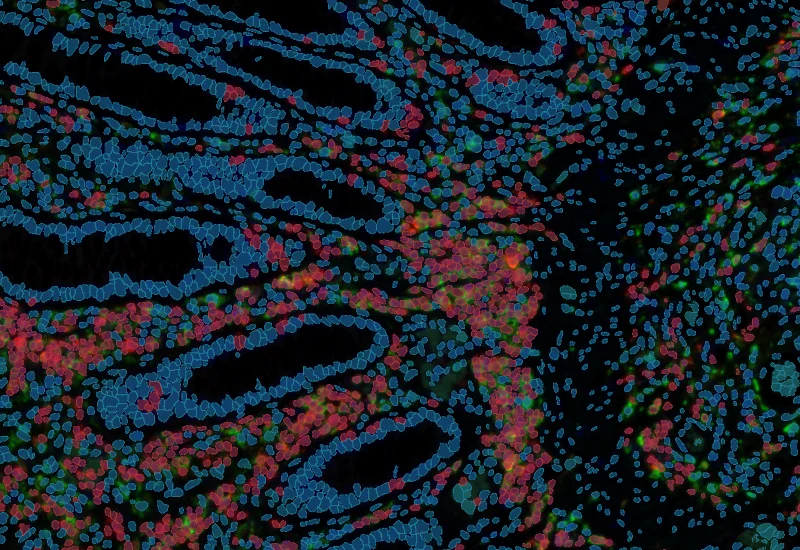
IHC Swiss Roll
The IHC Swiss Roll App segments the tissue into subclasses (mucosa, follicles, etc.), detects nuclei, and classifies phenotypes. Outputs include tissue areas, cell counts, and phenotype distribution per region.
mouse, colon, immunohistochemistry, immune cell follicles
IF Neuronal Cells
Detect neuronal cells and reconstruct neurites/dendrites, quantify primary and secondary branches, branching points, total cell area, branch length, and branch area.
neuronal cells, microglia, central nervous system, peripheral nervous system, phagocytosis, astrocytes, branches, fluorescence
Mucin Swiss Roll
The Mucin Swiss Roll App segments tissue into subclasses, detects nuclei and mucin (e.g. PAS-stained), and outputs tissue areas, cell counts, and mucin area per region and overall.
mouse, colon, mucin, immune cell follicles
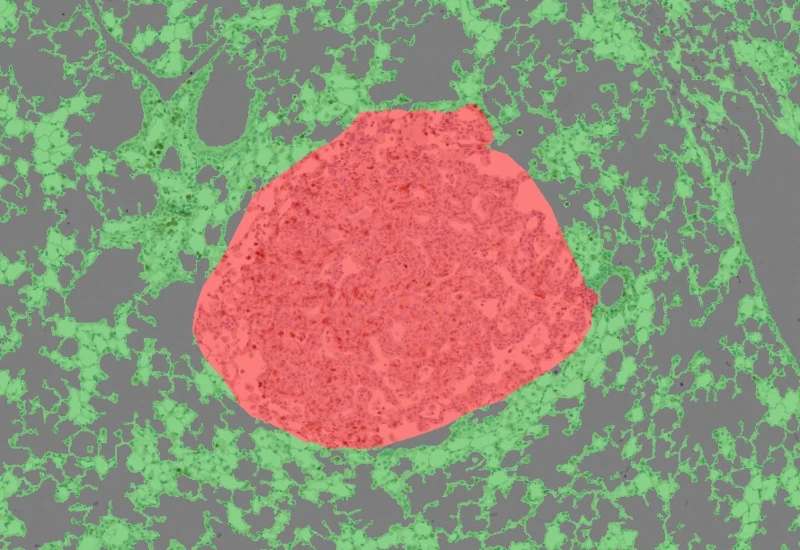
Lipid Droplets
The Lipid Droplets App quantifies lipid droplets in H&E-stained tissues, correcting membrane artifacts and providing counts and area measurements.
liver, lipid droplets, H&E, brightfield
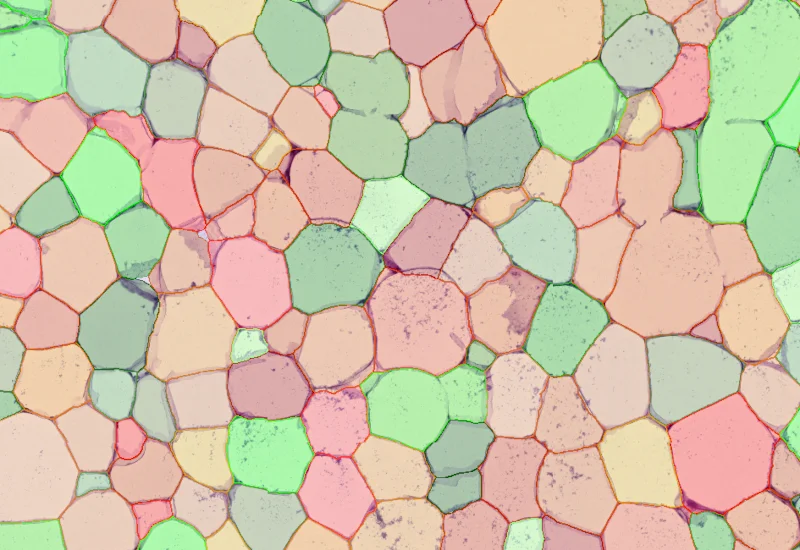
IHC Adipocyte
The IHC Adipocyte App quantifies adipocytes and their lumina in HE samples, correcting membrane artifacts and providing area measurements.
adipocytes, fat tissue, fat cells, H&E
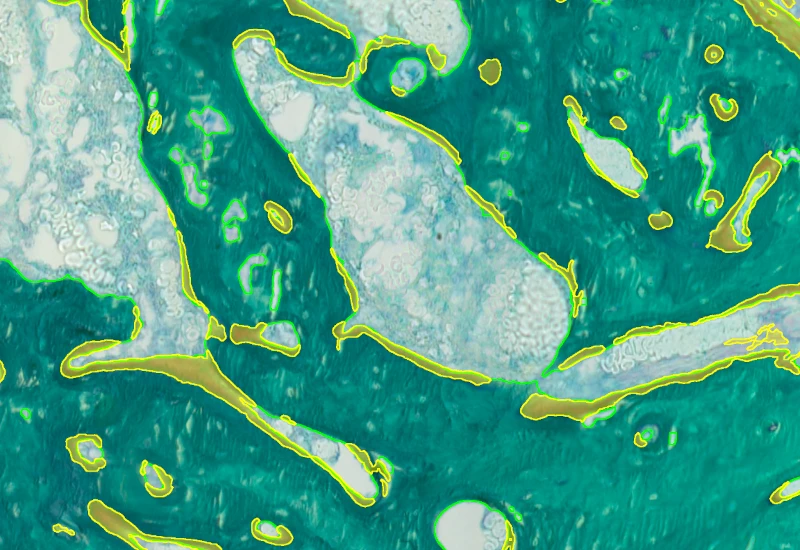
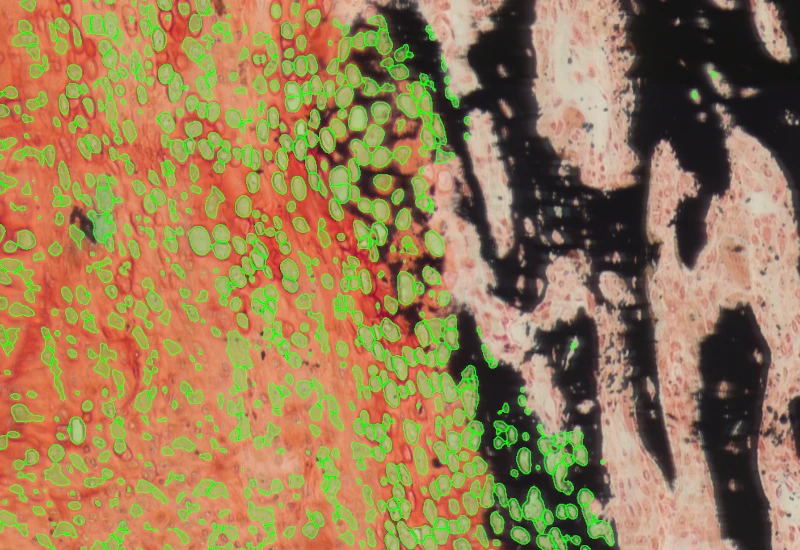
Bone Goldner
Detect mineralized bone and osteoid in Goldner-stained sections and measure BV, TV, OV, OV/BV, OV/TV, OS, BS, mean osteoid width, and mean osteoid thickness.
goldner staining, mineralized bone, osteoid, BV, TV, OV, OS, BS, brightfield
Bone Mineralization
Separate Safranin O–stained bone into cartilage, mineralized cartilage, bone marrow, and mineralized bone, and measure TV, BV, MCV, CV, and BM.
Safranin O, bone mineralization, bone marrow, cartilage, TV, BV, MCV, CV, BM, brightfield

Bone von kossa
Detect mineralized bone in von Kossa–stained sections and measure TV, BV, BS, BV/TV, BS/BV, Tb.N, Tb.Th, and Tb.Sp.
mineralized bone, bone research, von kossa, osteoporosis, brightfield
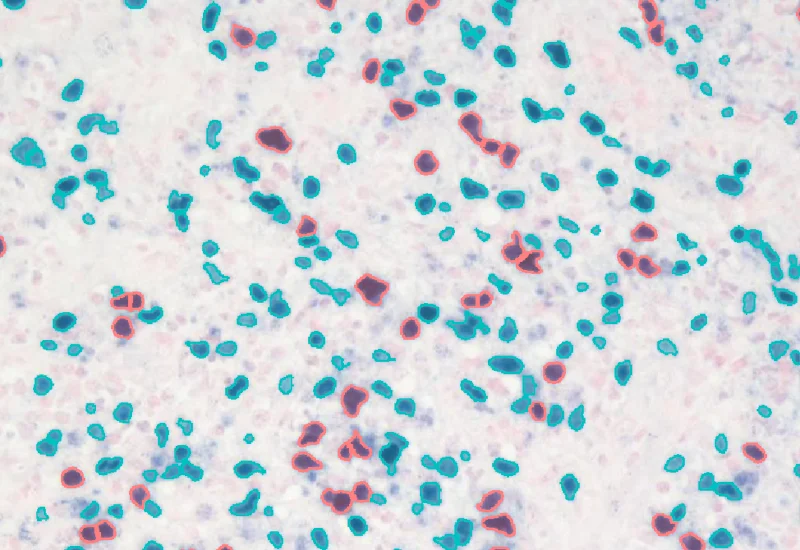
EBER-ISH
Detect nuclei and identify EBER-ISH–positive cells in EBV-stained tissue, and quantify total cell number, and number, density, and percentage of positive cells.
EBER-ISH probes, Epstein-Barr virus (EBV), infection
Endometrium Morphology
Segment H&E-stained endometrium into glands, stroma, and blood vessels, and quantify the area of each morphological entity.
endometrium, endometriosis, H&E, glands, blood vessels, stroma, gynecology
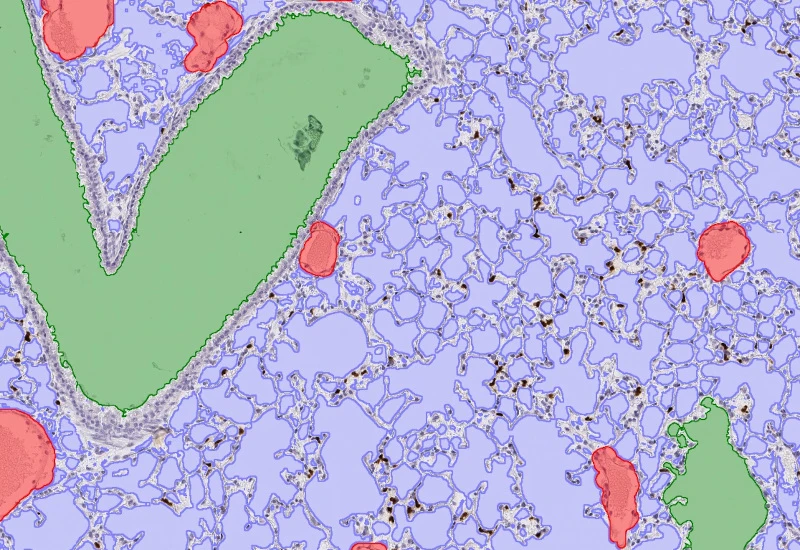
HE Alveoli Hamster
Detect nuclei and alveoli in HE-stained lung sections, classify alveoli into user-defined size ranges, and quantify tissue area, total alveoli area, and number/% per size class. Adaptable to other species.
hamster, rodents, H&E, lung, aveoli, pneumology
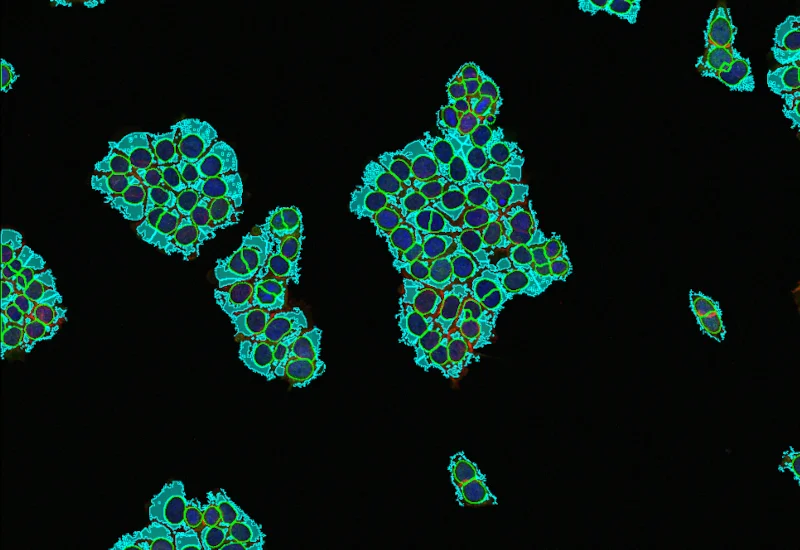
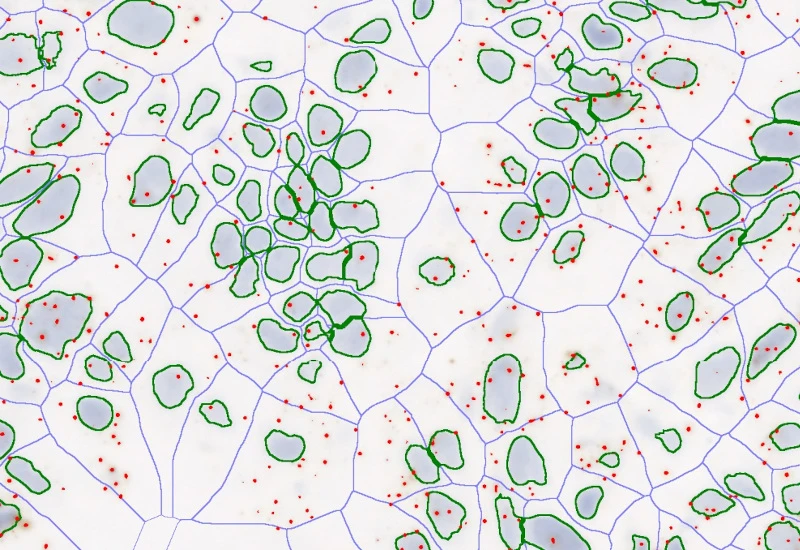
IF 2
Analyze single-cell co-expression of two IF markers, segment cells into nucleus, perinuclear area, and/or cytoplasm, and export up to 20 intensity, statistic, and morphometric parameters.
co-expression, fluorescence, prostate cancer, epithelial cells
IF 3
Analyze single-cell co-expression of three IF markers, segment cells into nucleus, perinuclear area, and/or cytoplasm, and export up to 20 intensity, statistic, and morphometric parameters per compartment.
co-expression, cytoplasmic staining, phenotyping, fluorescence
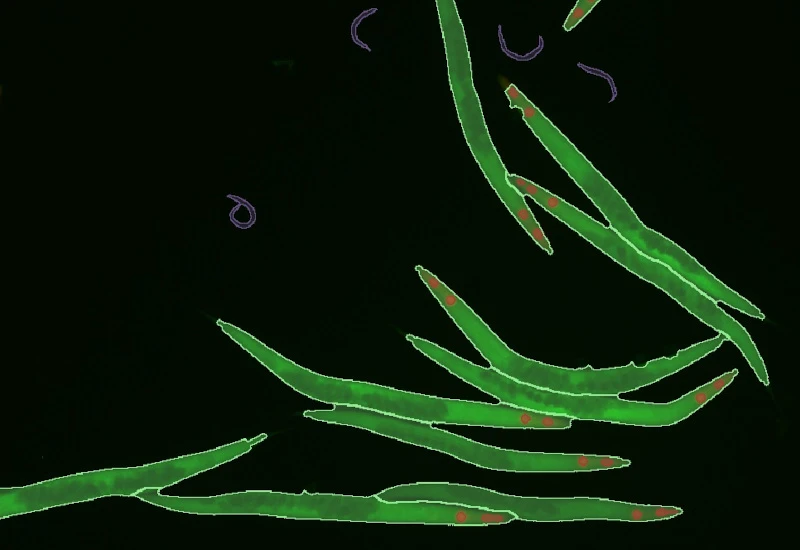
IF C.Elegans
Detect fluorescently labeled C. elegans, classify worms into size classes, quantify area, length, width, and internal marker intensity, and measure marker intensity in defined proximity zones around each worm.
parasite, C. elegans, fluorescence
IF Cardio Cell Culture
Detect nuclei and identify cardiomyocytes in IF-stained cell cultures, reconstruct cytoplasmic masks, and quantify cardiomyocyte number, area, and marker intensity.
cardiology, cardiomyocytes, cell culture, fibroblasts, troponin red

IF Cell Culture - Osteoclast
Segment nuclei, identify multinucleated osteoclasts, and quantify cell number, nuclei per osteoclast, osteoclast area, and marker intensity within osteoclasts.
bone research, osteoclast, multinucleated cells, bone adsoprtion
IF Cellular Contact
Determine cellular phenotypes in IF-stained samples, analyze direct cell–cell contacts, and quantify marker intensity, morphometric parameters, and number/% of contacting phenotypes.
cell contacts, spatial interactions, phenotype interactions, B cells, T cells, lung, lymph node, COVID-19, SARS-Cov-2
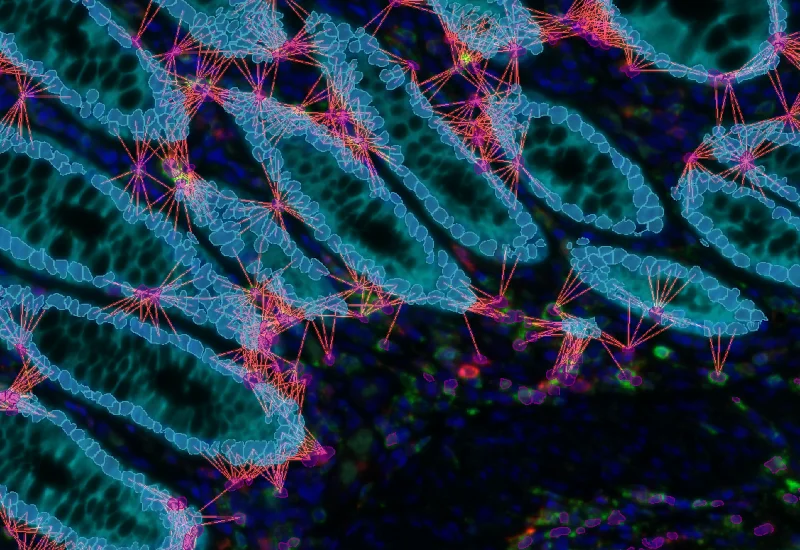
IF Cellular microenvironment
Determine phenotypes of specific IF-stained cell populations, analyze spatial relationships to neighboring cells and metastructures (e.g. vessels, tumors), and perform proximity and infiltration analyses.
phenotyping, phenotype interactions, proximity map, spatial landscape, immune cells, tumor, colon cancer, TMA, Foxp3, CD4, CK, PD-1, T regulatory cells, fluorescence

IF Cultured Cells & Substructures
Detect nuclei-based cells, quantify dot markers per cell, and measure cytoskeletal filament density and dot intensity at single-cell level.
FISH, cell culture, cytoskeleton, actin fibres
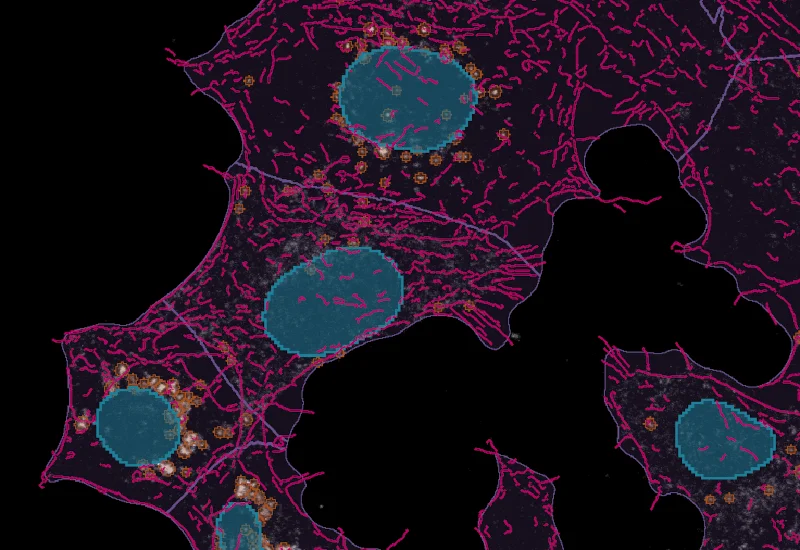
IF Cytoskeleton
Detect cytoskeletal structures by specific stain, identify cytoplasm with additional markers, and export filament count (inside, outside, membrane), filament length, and total filament area.
actin, cytoskeleton, cortical fibres, microfilaments, stress fibres, cell culture, fluorescence
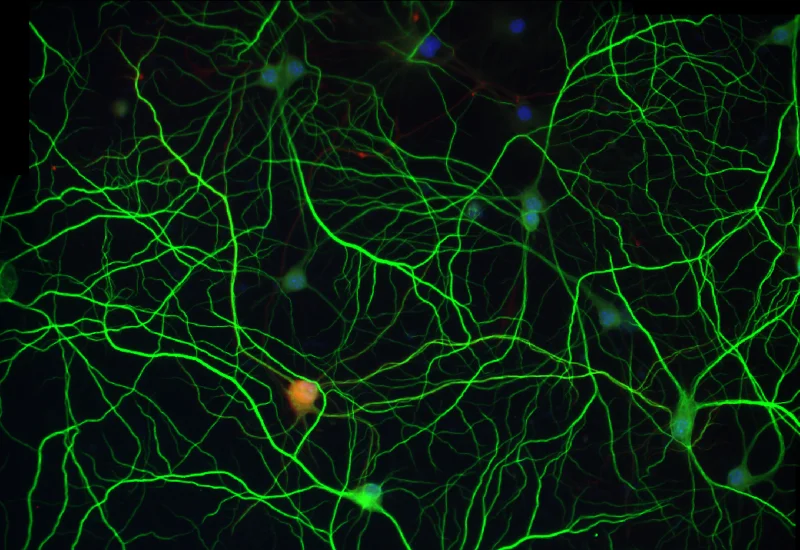
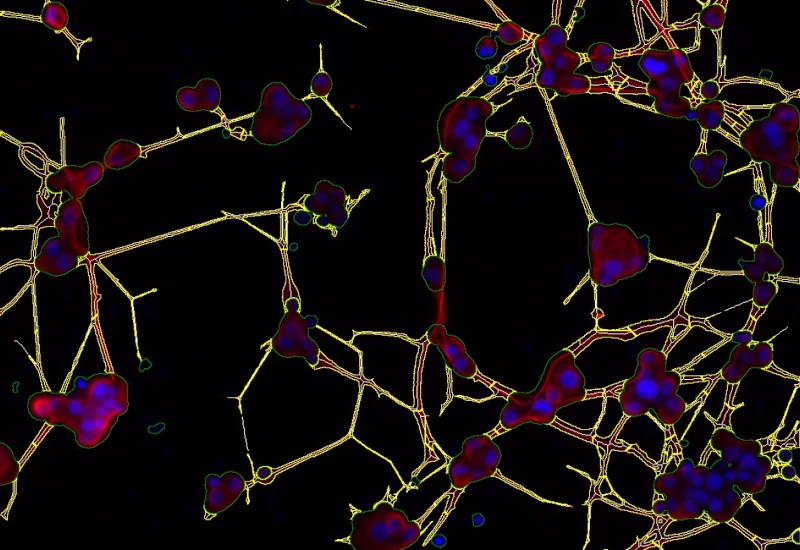
IF Dendrites & Axons
Detect neurons, segment dendrites and axons, and quantify dendrite number per neuron and total dendrite and axon length.
dendrites, neuron, axon, neuroscience, cell culture, primary dentrites, secondary dentrites, branches

IF Dots
Detect dots-stainings per cell in up to four markers, segment cellular compartments, measure up to 20 intensity, statistic, and morphometric parameters, and quantify dot count, mean intensity, total area, intensity sum, and per-dot area/intensity per compartment.
cell culture, breast cancer, fluorescence, HER2
IF Dots Colocalization
Detect dot-like signals (e.g., FISH, RNAscope) in multiple fluorescence channels and quantify dot number, size, and colocalization between markers.
FISH, cell culture, RNAScope, colocalization
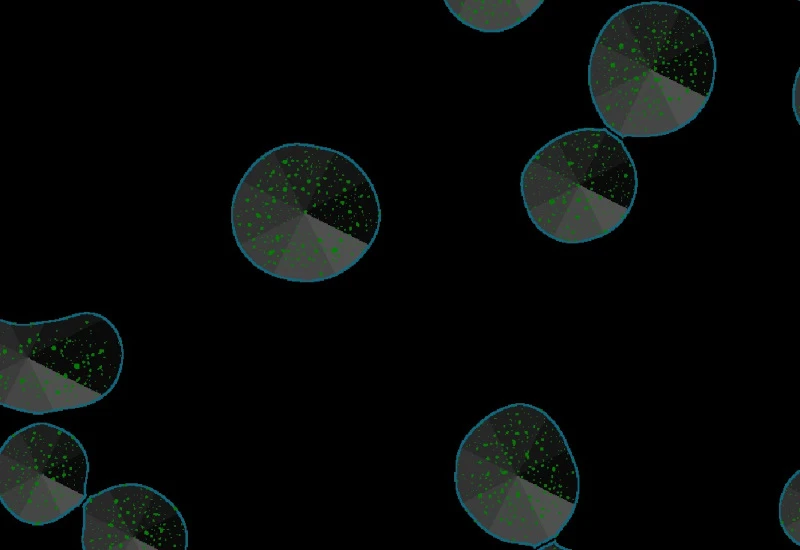
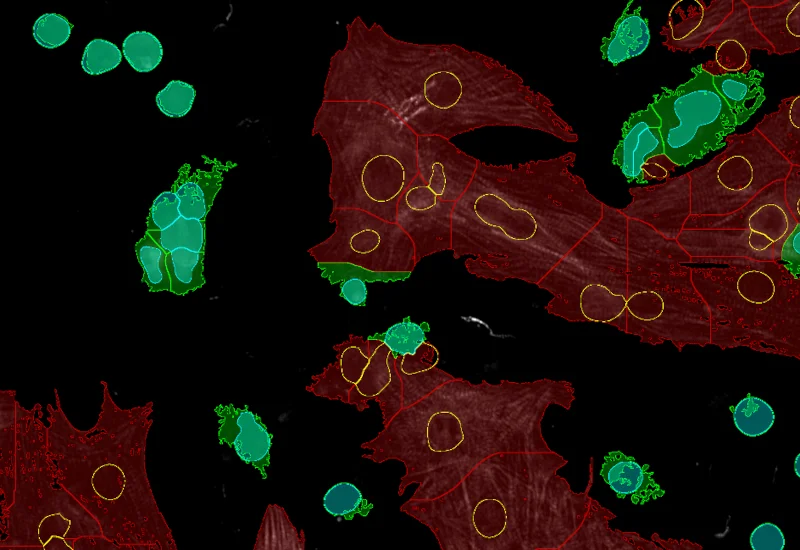
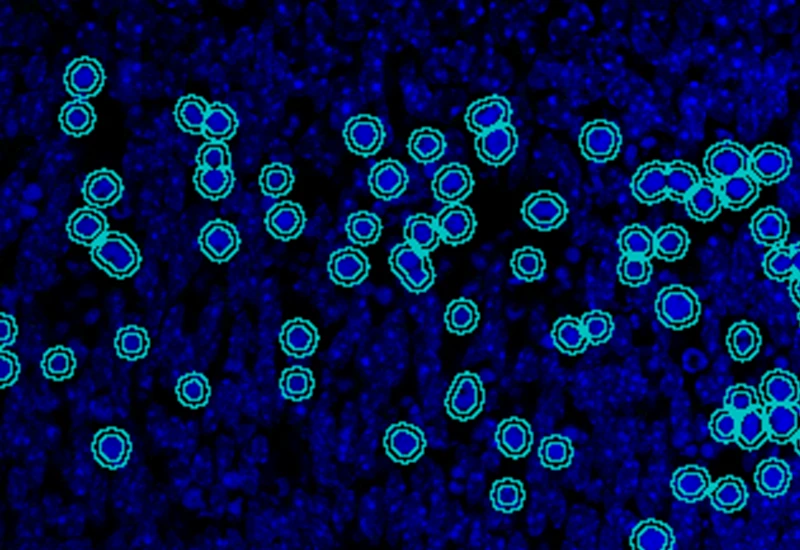
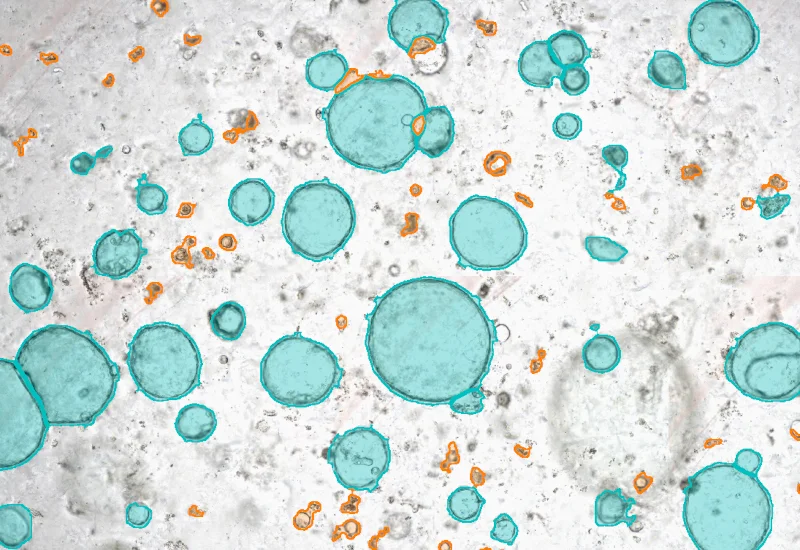
IF Embryoid Bodies
Detect embryoid bodies/organoids in IF-stained samples, segment nuclei, identify cellular phenotypes in nuclei or membrane, and quantify organoid number, area, and phenotype distribution.
embryoid bodies, cell culture
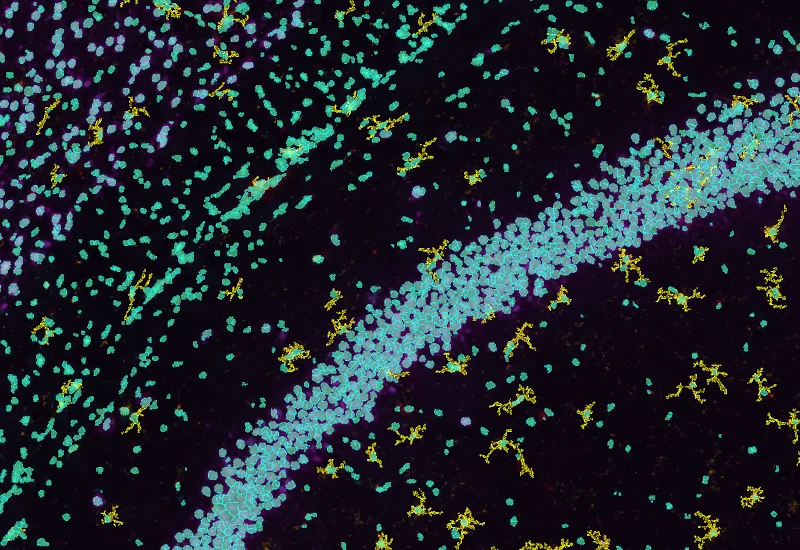
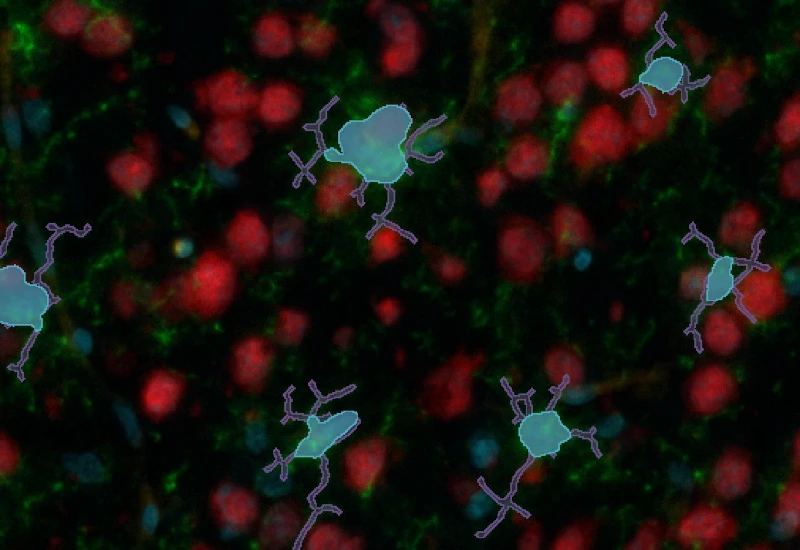
IF Glial cells
Detect astrocytes and microglia in IF-stained samples and measure cell counts and the number of short and long branches per cell.
microglia, central nervous system, peripheral nervous system, phagocytosis, astrocytes, branches, fluorescence
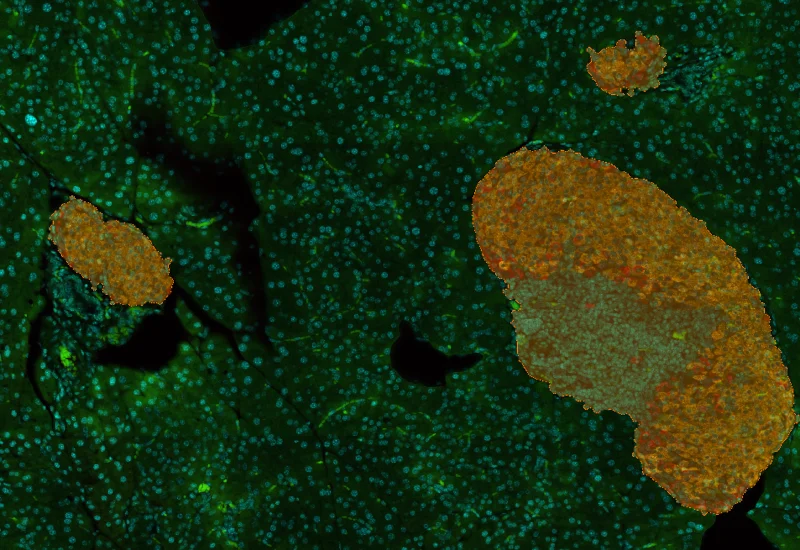
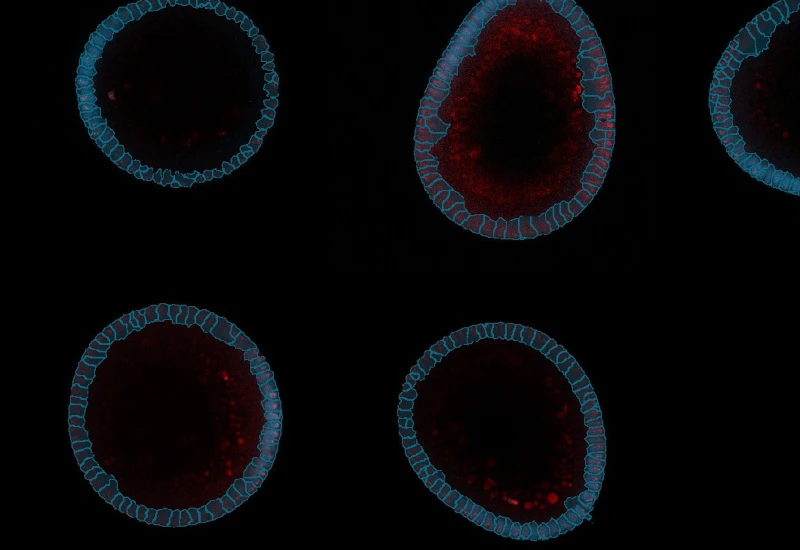
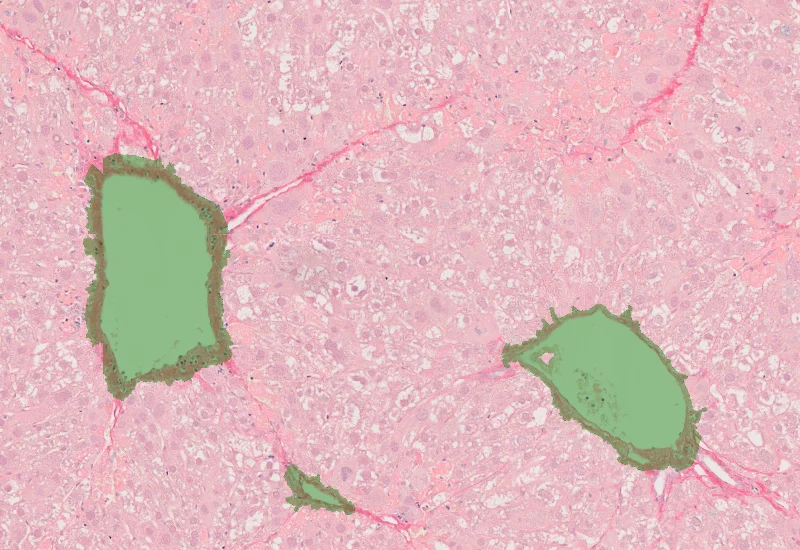
IF Glomeruli
Detect tissue, cells, and marker-stained glomeruli, segment cells into nucleus and/or cytoplasm, define phenotypes of IF-stained populations, classify cells inside or at defined distances from glomeruli.
glomeruli, kidney, renal research, fluorescence
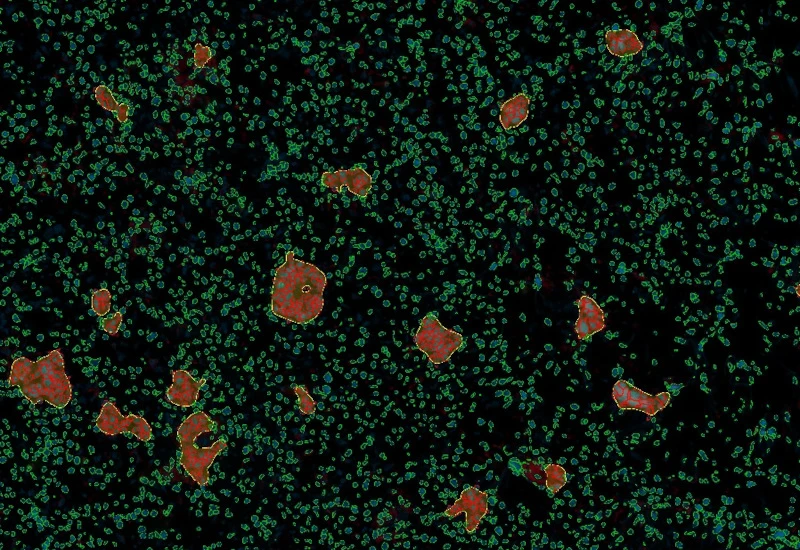
IF Granuloma
Detect granulomas using nuclear structure analysis and IF markers (e.g. CD11c, CD68), measure granuloma number, area, and density, and export up to 20 intensity, statistic, and morphometric parameters per cell compartment.
dentritic cells, macrophages, inflammation, granulomas, mouse, liver, fluorescence, microeinvironment, immune cells

IF Hi-plex 50
Combine and analyze up to 50 IF-stained images of the same tissue, define cellular phenotypes, segment cells into nucleus, perinuclear area, and/or cytoplasm.
multiplexing, immune cells, immune landscape, t cells, b cells, marcophages, monocytes, dentritic cells, MELC, skin, mouse, fluorescence
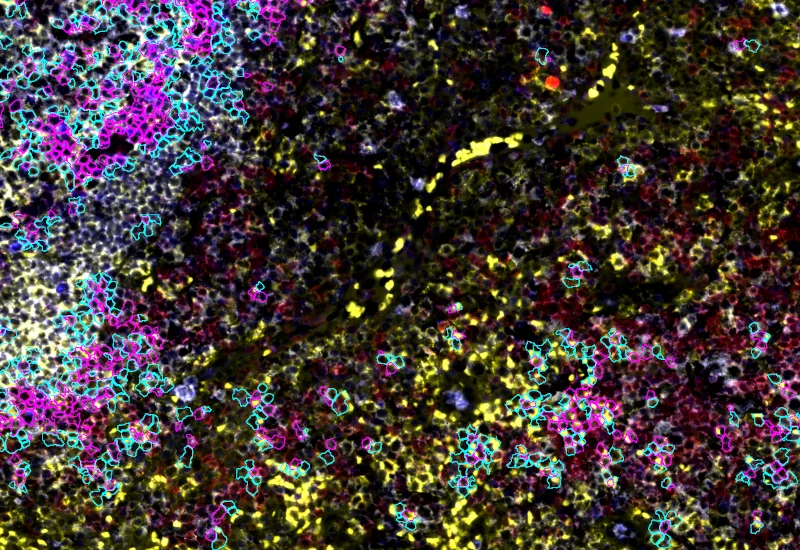
IF Immune status in situ
Characterize immune cell phenotypes relative to detected metastructures (e.g. tumors, glands), define distance ranges, measure cell-to-boundary distances inside/outside, and export up to 20 intensity, statistic, and morphometric parameters per cell compartment.
colon cancer, cytotoxic t cells, tumor microenvironment, PD1, CD8, spatial analysis, fluorescence
.webp)
IF Leishmaniasis
Detect intracellular Leishmania in host cells, segment parasites, quantify parasites per cell, distinguish live/dead (specifc assay), and export 20 intensity, statistic, and morphometric parameters per compartment plus parasite count, mean intensityand size.
macrophages, parasites, leishmaniasis, cell culture, protozoan parasites, fluorescence

IHC 2
Separate two markers in IHC/HC slides, segment single cells into nucleus, perinuclear area, and/or cytoplasm, measure up to 20 intensity, statistic, and morphometric parameters per compartment.
immunohistochemistry, phenotypes, biomarker, brightfield
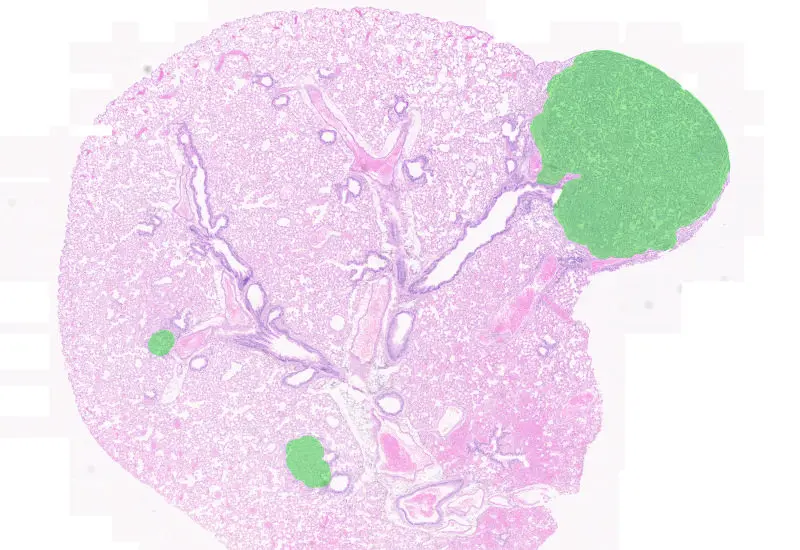
Tumor Foci
Detect whole tissue and tumor foci based on using nuclear structure analysis, measure number of tumor foci, area, and cellular density.
H&E, cancer tissue, TMA

Wilms Tumor
AI-based segmentation of H&E-stained Wilms tumor sections into tumor, stroma, and blood vessels with quantitative area measurements.
wilms tumor, H&E, nephroblastoma, kidney, renal cancer
IF Membrane
Detect nuclei, segment cells into membrane, cytoplasm, and nuclei, and quantify marker intensity, stained area, membrane length, angle, and percentage of positive cells per compartment.
spheroid, membrane

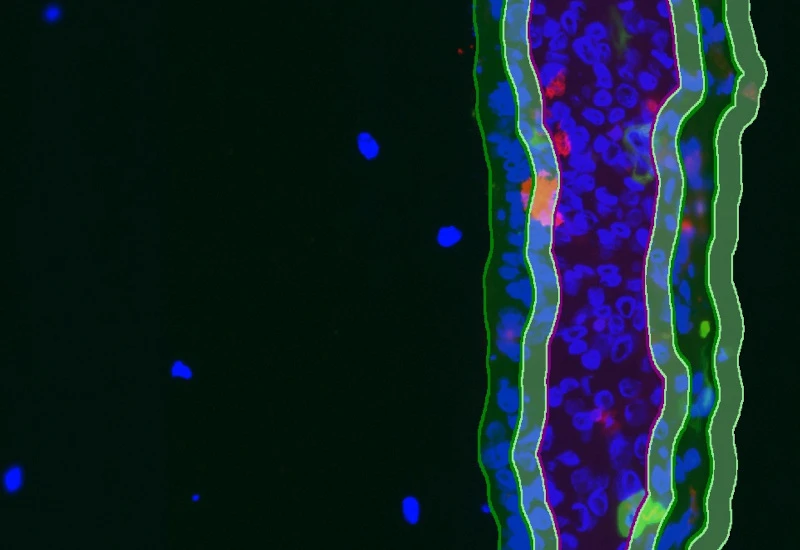
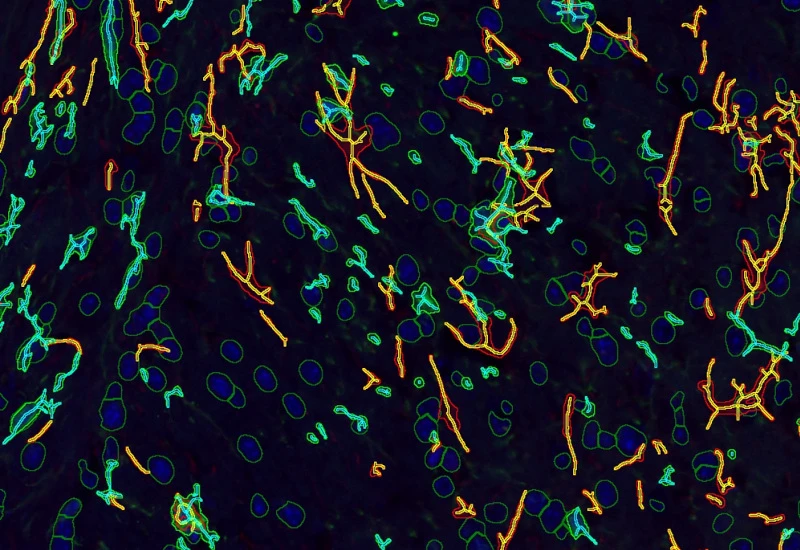
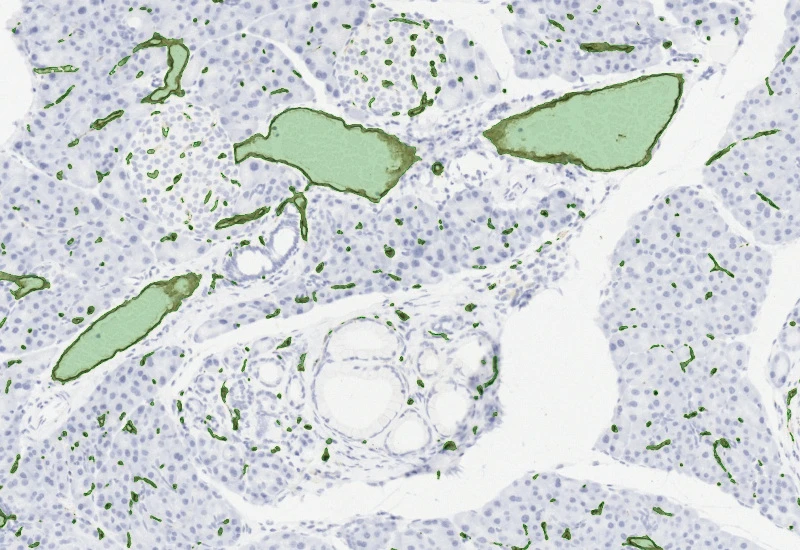
IF Retinal Vasculature
Detect blood vessels based on appropriate stains (e.g. CD31) in retinal tissue, and quantify vessel area, density and length.
retina, blood vessels, CD31, vascularization

IF Rods & Cones in Retina
Detect rods and cones based on specific staining, quantify structure number, length, and density, and measure number, percentage, and density of marker-positive rods and cones.
rods and cones, eye

IF Skeletal Muscle
Segment IF-stained skeletal muscle into muscle fibers and connective tissue, and measure fiber count, total tissue area, muscle fiber area, and connective tissue area.
skeletal muscle, muscle fibre detection, fluorescence
IHC 3
Unmix three markers in IHC/HC slides, segment single cells into nucleus, perinuclear area, and/or cytoplasm, measure up to 20 intensity, statistic, and morphometric parameters per compartment.
immunohistochemistry, brightfield
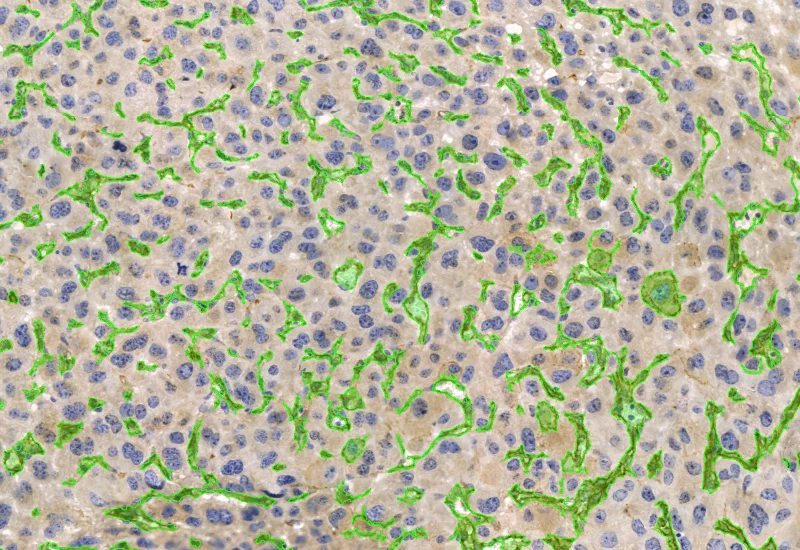
IHC Angio
Detect blood vessels based on appropriate stains (e.g. CD31), measure vessel and lumen areas, and export vessel number, density, and areas of vessels, endothelium, and lumina.
blood vessels, tumor vascularization, tumor microenvironment, brightfield
IHC Angio Diameter
Detect blood vessels based on specific markers (e.g., CD31), and quantify vessel area, number, density, and vessel diameter.
CD31, blood vessels, diameter

IHC Angio Elastin
Detect blood vessels in Verhoeff–Van Gieson–stained sections and quantify vessel number and area, as well as elastin and collagen area and intensity within user-defined perivascular rings.
blood vessels, elastine, collagen, muscle fibres, spatial interactions, Verhoeff van Geison staining
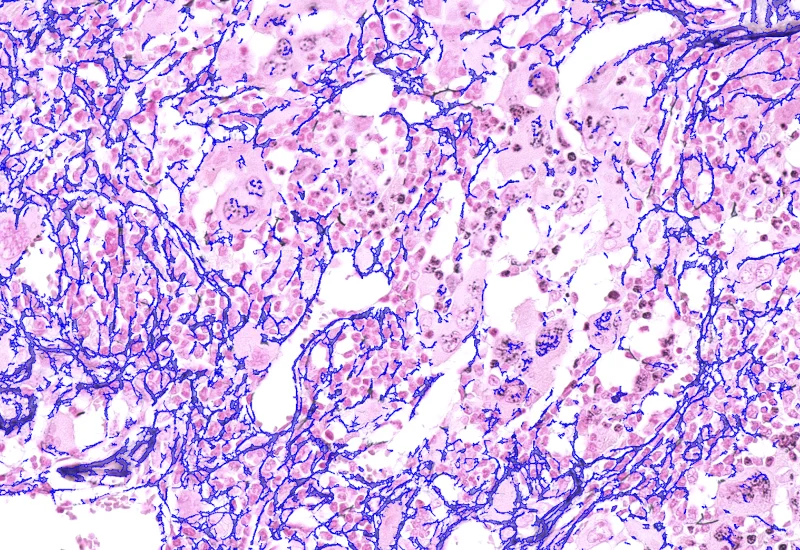
IHC Extracellular Filaments
Detect nuclei and extracellular filaments in IHC-stained sections, and quantify nuclei number, total filament area, and filament length.
filaments
IHC Membrane
Unmix up to three markers in IHC/HC slides, segment cells into nucleus, perinuclear area, cytoplasm, and membrane (e.g. HER2/neu), measure up to 20 intensity, statistic, and morphometric parameters per compartment plus membrane intensity and angle.
HER2, breast cancer, immunohistochemistry, automated scoring
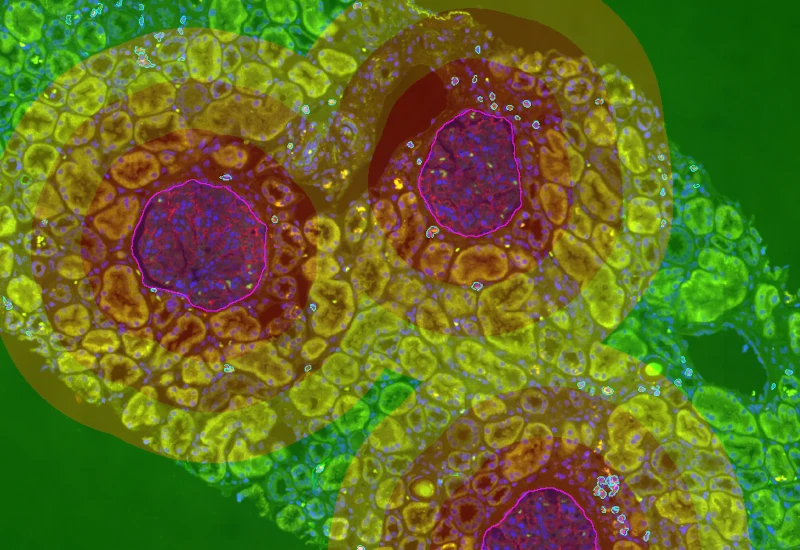
IHC Meta Cells
Detect IHC/HC-stained metastructures (e.g. islets, tumor, stroma) and segment single cells into nucleus, perinuclear area, and/or cytoplasm, classify cells inside/outside metastructures, and measure up to 20 intensity, statistic, and morphometric parameters per area and compartment.
insulin islets, pancreas, immunohistochemistry, beta-cells, brightfield
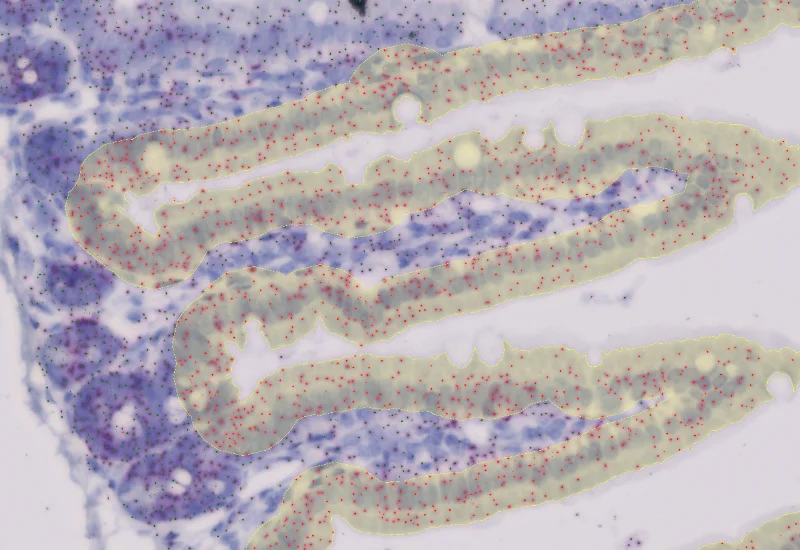
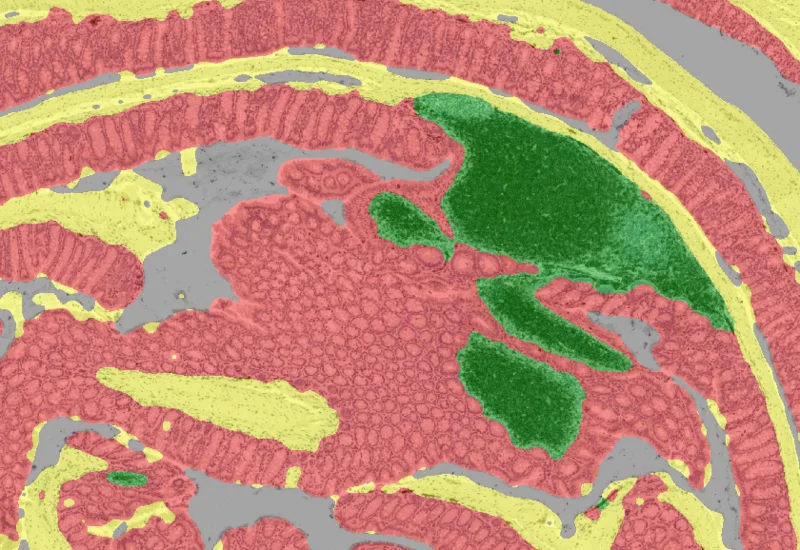
IHC Small Intestine - Dots
Segment nuclei and villi, detect single dot markers (CISH/RNAscope/SISH) in villi and manually defined crypts, and quantify dot count, area, intensity, and distribution per region.
small intestine, crypts, villi, RNAScope, CISH
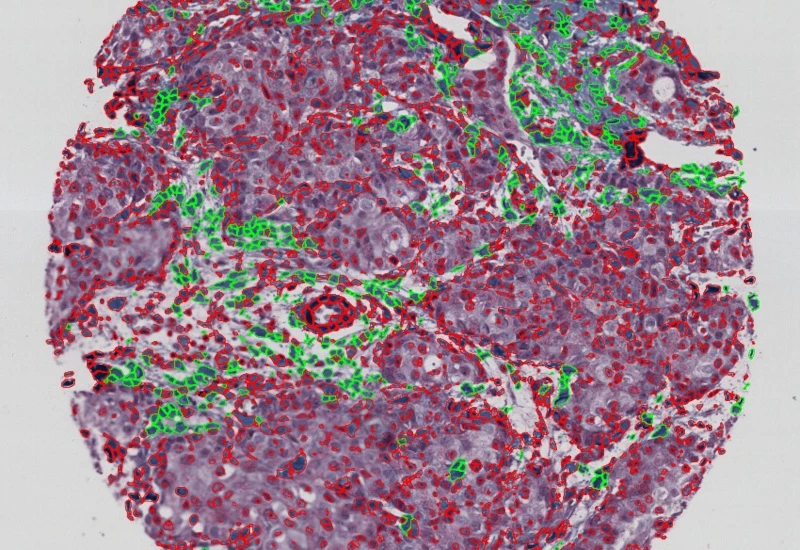
IHC Tumor-Stroma
Segment tumor and stroma by morphology, detect specifically stained cell populations, segment cells into nucleus, perinuclear area, and/or cytoplasm, and measure up to 20 intensity, statistic, and morphometric parameters per compartment.
TMA, tumor, stroma, immunohistochemistry, brightfield
RNA Scope
Detect nuclei and single-marker dots (CISH/SISH), segment nucleus and/or cytoplasm, measure up to 20 intensity, statistic, and morphometric parameters, and quantify dot count, mean intensity, total area, intensity sum, and per-dot area/intensity per cell.
RNAScope, brightfield, CISH, ISH

RNA Scope+
Detect nuclei and quantify two RNA scope dot markers per cell in nucleus and/or cytoplasm for CISH and SISH assays, measuring up to 20 morphometric and intensity parameters plus per-cell dot count, area, and intensity metrics.
CD31, blood vessels, diameter
Sirius Red Angio
Detect Sirius Red–stained collagen and blood vessels, and quantify collagen area and total vessel count within the analyzed tissue.
sirius red, collagen, blood vessel, vascularization, liver
IF Neurite
Detect neuronal cells and clusters with their neurites/dendrites, quantify branching per neuron, and export total area, length, average thickness, branch points, and endpoints.
cell culture, fluorescence, neurites
IF Pyknotic Nuclei
Detect tissue, segment cells, and identify pyknotic nuclei by nuclear staining, define IF-stained phenotypes, perform dot detection, segment nucleus/perinuclear area/cytoplasm, and export counts, mean intensity etc.
pyknotic nuclei, chromatin, necrosis, apoptosis, cell culture, fluorescence
IF Skin Morphology
Segment epidermis and dermis in skin tissues, segment cells into nucleus, perinuclear area, and/or cytoplasm, define phenotypes of stained populations, classify cells inside/outside structures.
dermatology, epidermis, dermis, skin, fluorescence

IF Spheroids
Detect spheroids and nuclei-based cells, segment cellular compartments, quantify multiple IF markers and dot signals, and analyze spatial proximity of cell populations within spheroids.
spheroid, membrane, 2D and 3D culture, Human colon cancer cell lines
IF Tumor Foci Angio
Detect single nuclei and segment tissue into tumor foci and blood vessels, apply proximity mapping to quantify nuclei distances to vessels, and measure compartment areas and nuclei distribution.
tumor, tumor microenvironment, blood vessels, tumor foci, spatial analysis
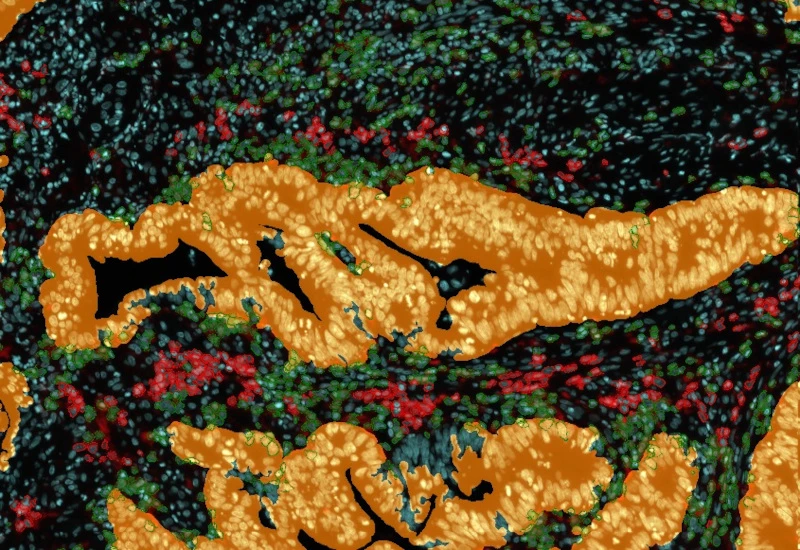
IF Tumor Vascularization
Segment tissue into tumor and stroma/healthy areas, detect CD31+ vessels, and quantify vessel number, area, density, and connectivity with configurable wall closing and distance linking.
vasculatization, cancer, stroma, tumor, blood vessels, CD31, spatial analysis, tumor microenvironment
IHC Angio Trichome
Detect trichome-stained vessels, quantify vessel, lumen, and endothelium areas, measure wall thickness and density, and analyze spatial proximity of IHC-stained cells to vessels.
trichome staining, blood vessels, collagen, muscle fibres, spatial interactions

IHC Immune Status in Situ
Segment tissue into tumor, stroma, and lymphocyte clusters using an AI classifier, detect hematoxylin-stained nuclei and immune phenotypes (e.g., CD45, CD3, CD20), and quantify spatial immune distribution.
bladder cancer, CD45, immune cells, tumor immune microenvironment, tertiary lymphoid structures, spatial analysis
IHC Macrophages
Detect macrophages in IHC samples, apply area and distance-range algorithms to measure Langerhans cell distances to the epidermis border inside/outside, and export up to 20 parameters per cell compartment plus boundary distance.
immune cells, brightfield, macrophages, immunohistochemistry, epidermis, langerhans cells, dermatology, CD68
IHC Necrotic Tumor
AI-based segmentation of tumor tissue into tumor, necrotic tissue, and stroma with neutrophil detection and compartment-based quantification.
neutrophiles, tumor, necrosis, necrotic tissue, immunophenotyping, mouse tissue

IHC Necrotic Tumor Angio
Segment tumor tissue into tumor, necrotic tissue, and blood vessels using an AI classifier, and quantify compartment areas, total vessel count, and vessel distribution across morphological entities.
tumor immune microenvironment, tumor microenvironment, necrosis, blood vessles, vascularization, tumor
IHC Tumor Macrophages
Segment tissue into tumor and healthy areas, detect CD68+ macrophages, and quantify macrophage area within each tissue compartment.
macrophages, tumor, pancreas cancer, CD68, tumor microenvironment

IHC Tumor Vascularization
Segment tissue into tumor and healthy/stromal regions, detect blood vessels (e.g., CD31), and quantify vessel number, area, density, and connectivity within each compartment.
blood vessels, tumor vascularization, tumor microenvironment, CD31, pancreas
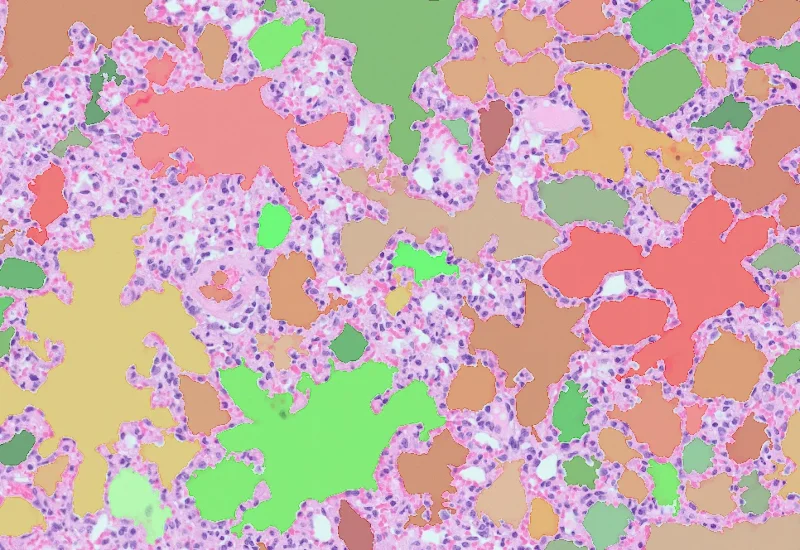
Pulmo
Segment nuclei and lung metastructures (total tissue, bronchioles, vessels, alveoli), detect cellular phenotypes within each component, and measure up to 20 morphometric parameters per metastructure and nucleus.
lung cancer, lung anatomy, bronchioles, blood vessels, alveoles, immunohistochemistry, neutrophiles, brightfield
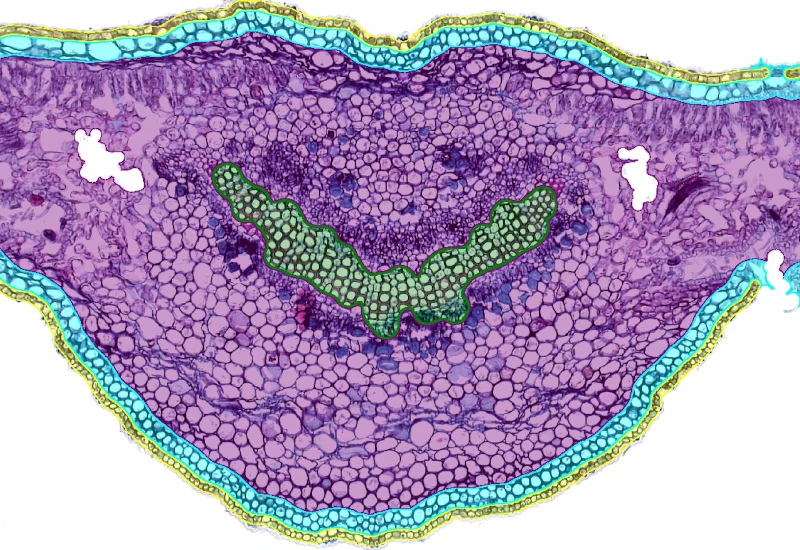
Nerium Leaf
Segment Nerium leaf into epidermis, hypodermis, mesophyll, and xylem; detect cells, analyze spatial proximity to xylem, and quantify substructure areas and cell distributions.
botanical research, botany, plants, nerium leaf, epidermis, hypodermis, mesophyll, xylem
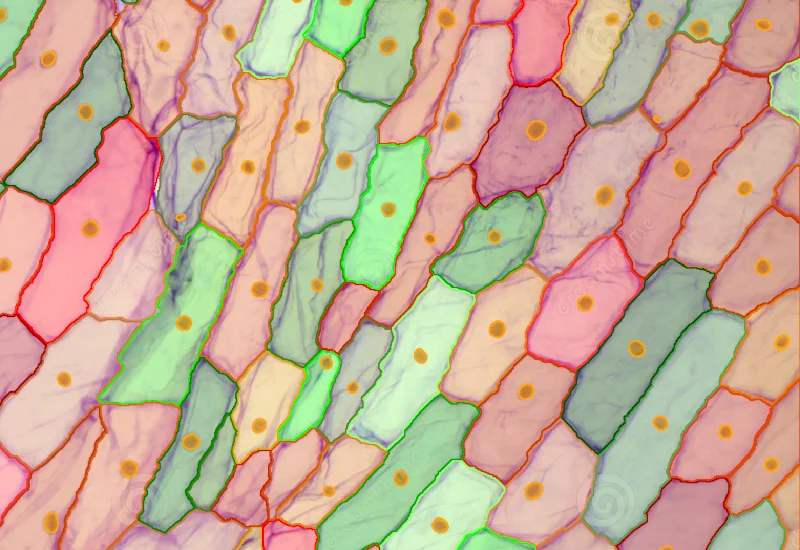
Onion
Quantify onion epidermal cells and nuclei, classify cells into user-defined size ranges, and output total cell number, size (µm²), density, and counts per size category.
botanical research, botany, plants, onion, epidermal cells
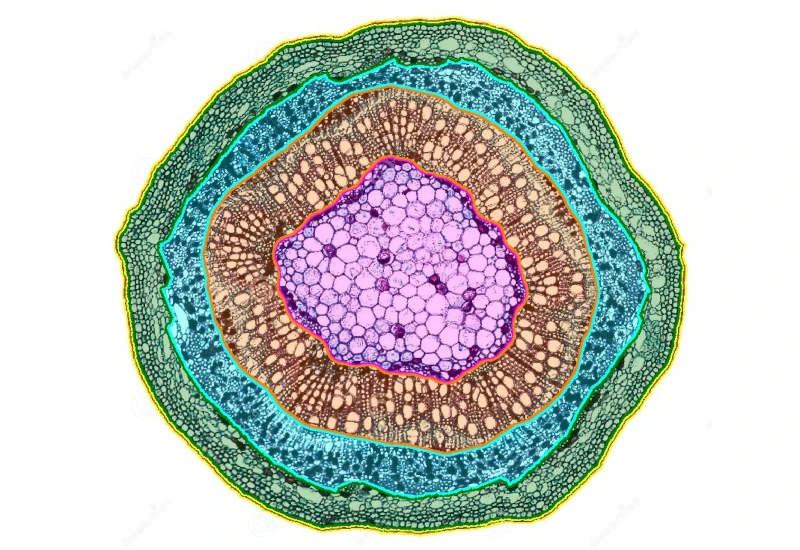
Plant Root
Segment plant roots into epidermis, cortex, endodermis, pericycle, and stele; detect cells and quantify area and cell count per anatomical structure.
botanical research, botany, plants, plant root, epidermis, cortex, endodermis, pericycle, vascular cylinder
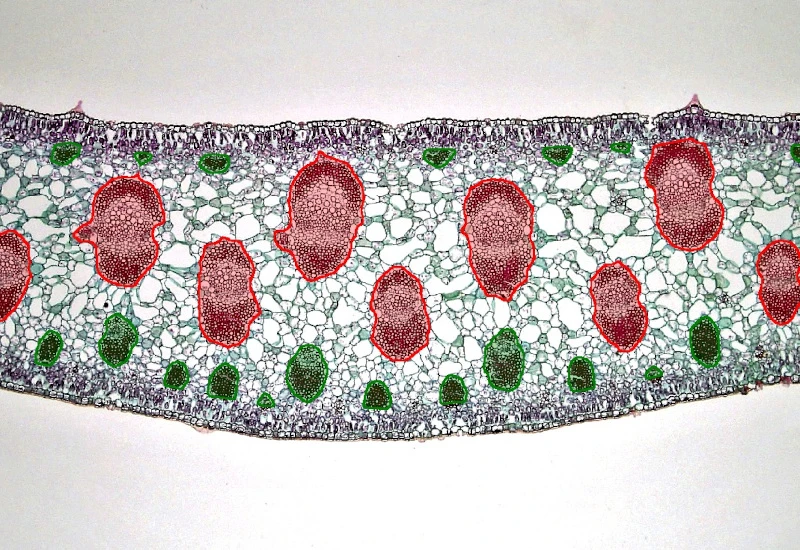
Yucca Leaf
Segment Yucca leaf into epidermis, collenchyma, parenchyma, and vascular bundles; detect cells, classify vascular bundles by size, and quantify substructure areas and spatially defined cell distributions.
botanical research, botany, plants, yucca leaf, epidermis, collenchyma, parenchyma, vascular bundles
Organiod App
Detect cultured organoids using a machine learning classifier, quantify organoid number and total area (µm²), and classify organoids into defined size categories.
organoid quantification, immune cells, co-culture, machine learning
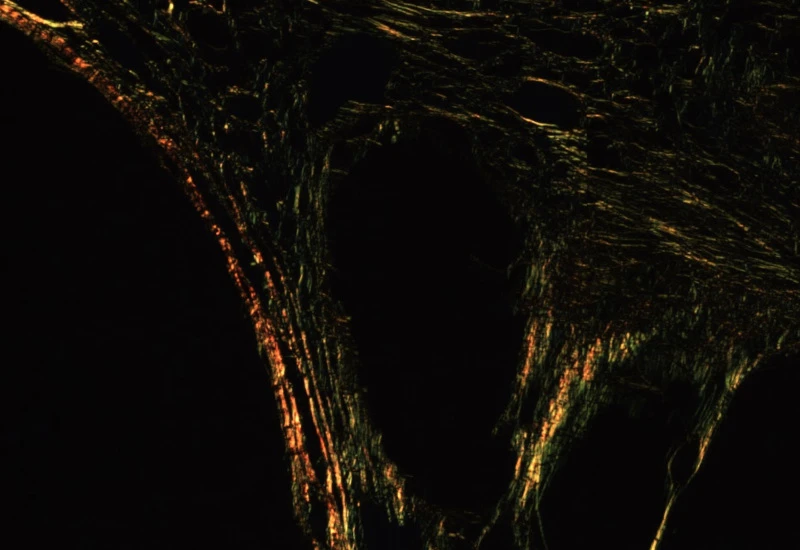
Sirius Red Polarized
Quantify collagen type I (red) and type III (green) fibers in Sirius Red–stained polarized images, measuring region area and the area of red, green, and overlapping (double-positive) fibers.
sirius red, collagen I, collagen III, polarized light, fibres

Stem Cell Colony Assay
Identify single cells, cell clusters, and cluster gaps within stem cell colonies, and quantify cluster area, cell area, gap area, and gap-based cluster classification.
stem cells, phase contrast, cell culture, stem cell colony