Application Notes
Explore the power of tissue cytometry to address complex biological questions using streamlined workflows and ready-to-use solutions tailored to your needs.
Application Note
12 Mar, 2025
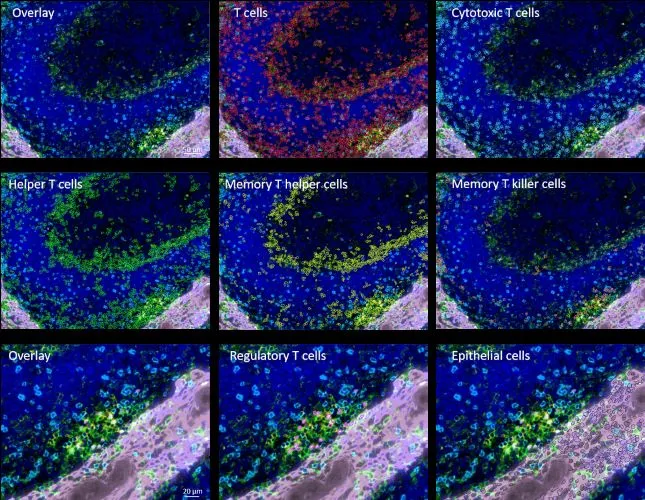
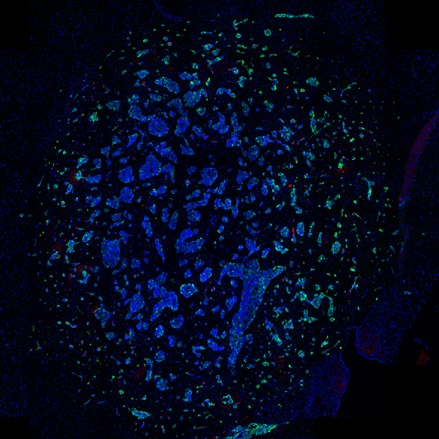
Investigating T-Cell Communities in Immune Tissues with StrataQuest 8
Multiplex fluorescence imaging of tonsil tissue analyzed in StrataQuest to quantify and map T-cell subsets within and around germinal centers.
Application Note
14 Oct, 2024
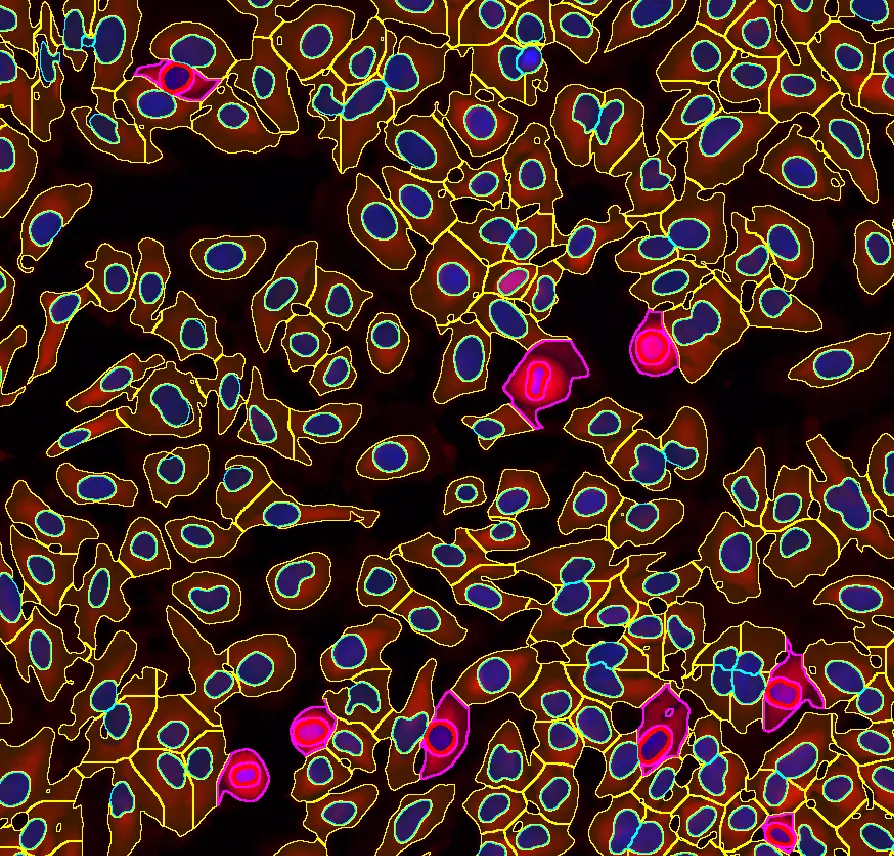
Quantitative Analysis of Cultured Cells
A case study using StrataQuest image analysis on IF-processed cultured cells. The workflow automated cell identification, nuclei and cytoplasm counting, and marker intensity quantification.
Application Note
11 Sep, 2024
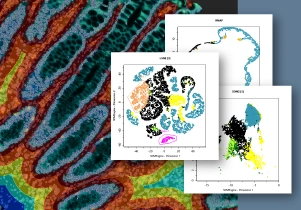
A Glimpse into StrataQuest 8: Spatial Analysis in Colorectal Cancer
The newest StrataQuest supports in-depth neighborhood analysis with exportable data for statistics. It includes manifold learning (t-SNE, UMAP, SONG), violin plots, 3D diagrams, and other tools that give full control of data.
Application Note
27 Jun, 2024
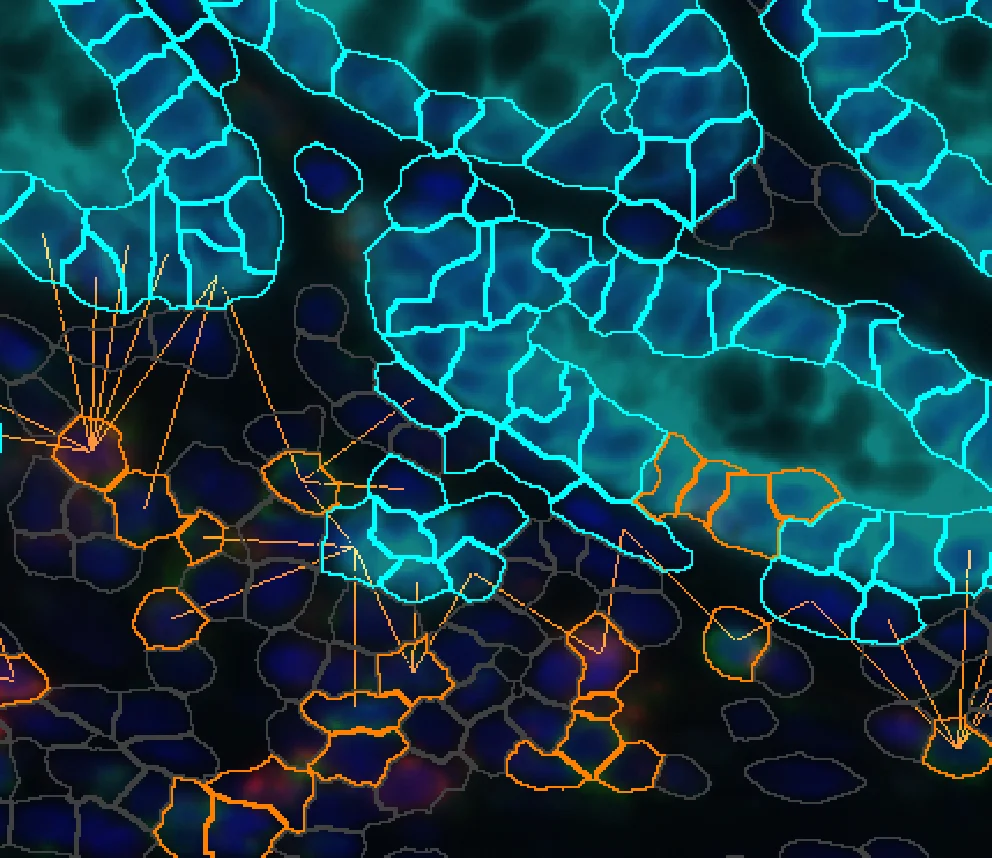
Spectral Imaging and Spatial Analysis of TMA Samples
Multispectral imaging of inflamed colon TMA samples using TissueFAXS Spectra and StrataQuest. The workflow combines spectral unmixing, detailed immune cell phenotyping, tissue classification, and spatial analysis of the immune microenvironment.

Application Note
01 Mar, 2024
TMA Analysis with StrataQuest
Tissue microarray (TMA) analysis demonstrates automated detection of nuclei, epithelial cells, and membranes, combined with machine learning–based tissue classification and spatial analysis of immune cells.
Application Note
14 Feb, 2024
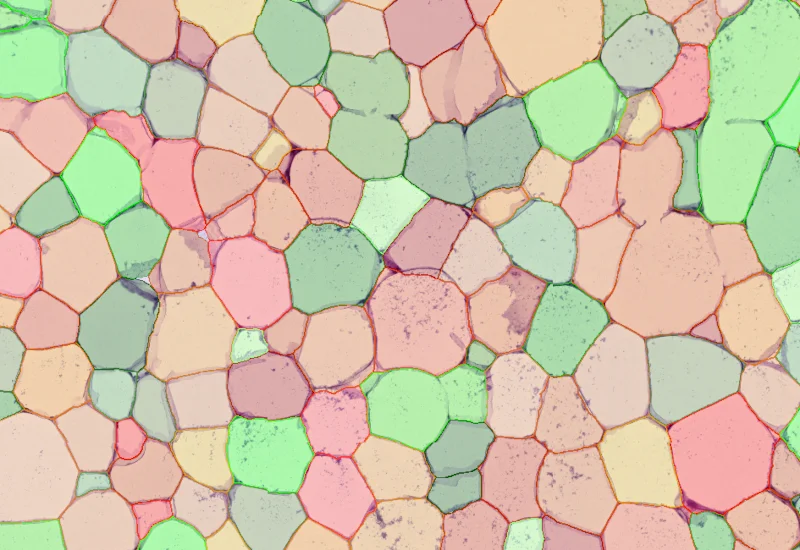
Adipocyte App: Measurement of Cellular Size of Adipocytes
Automated adipocyte detection and size measurement using the StrataQuest Adipocyte App. The workflow identifies adipocytes based on membrane detection and quantifies cell number, diameter, and size in H&E-stained fat tissue.
Application Note
15 Jan, 2024
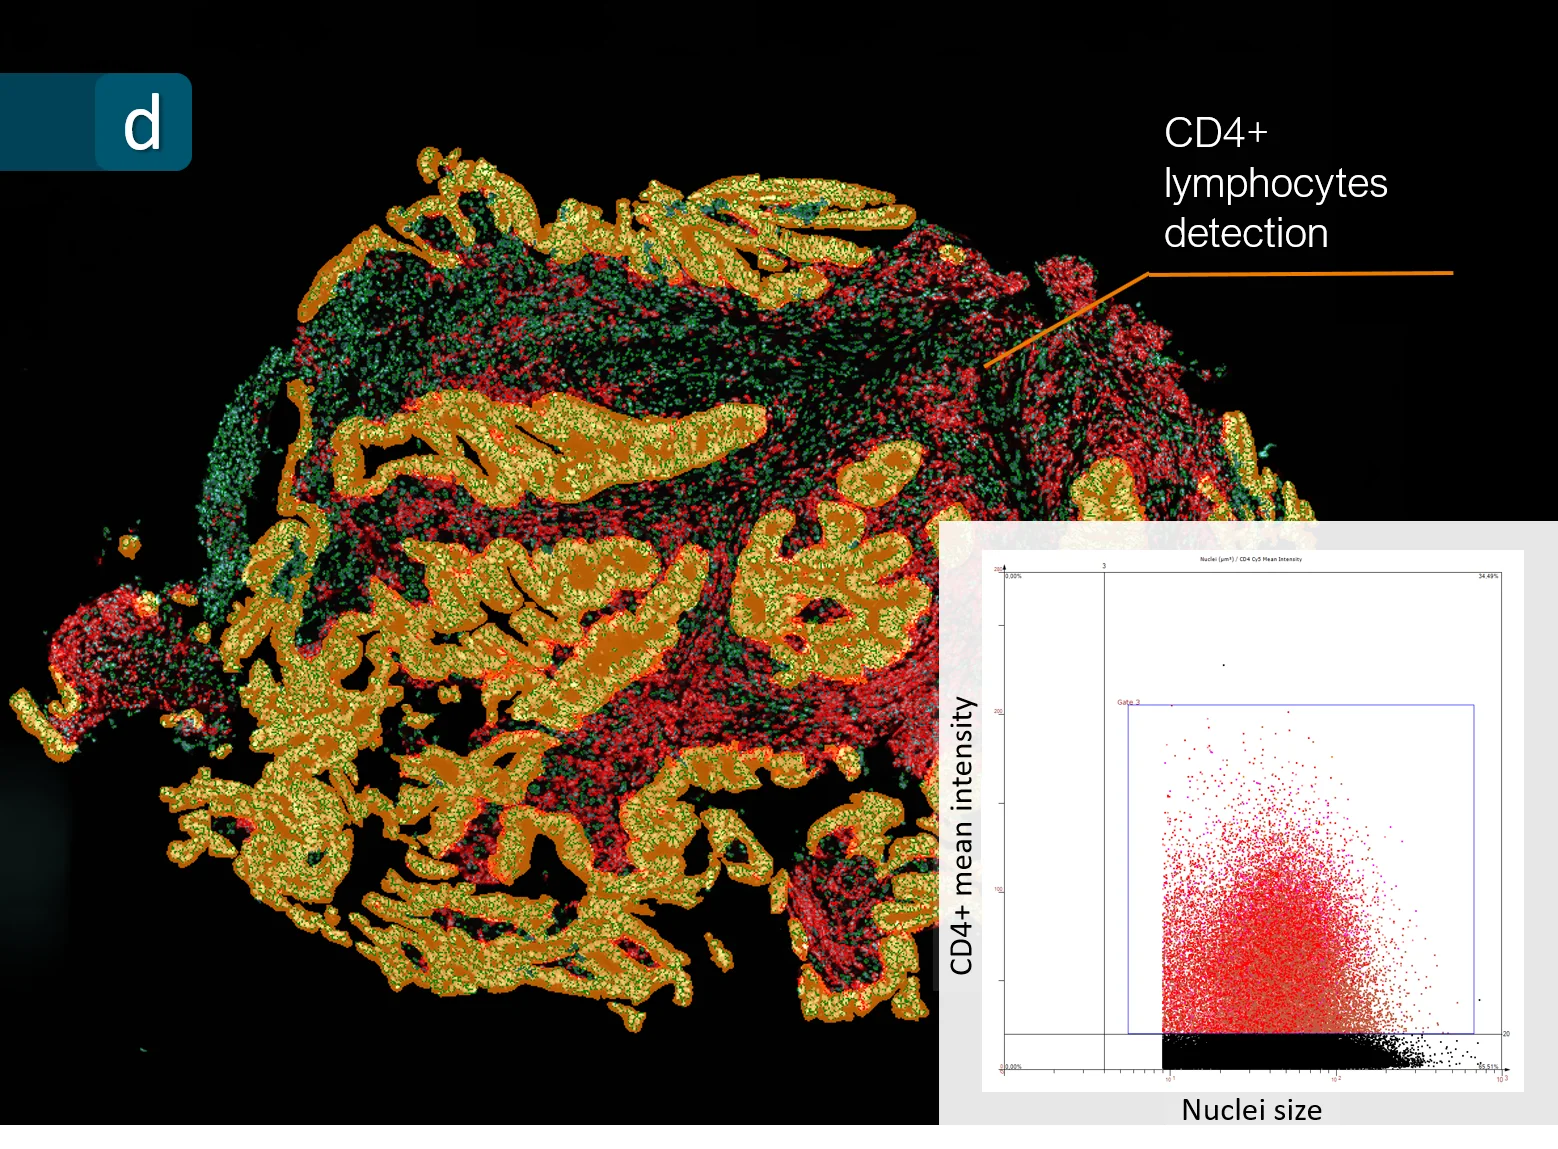
Spatial Analysis of CD4+ Cells in Colorectal Cancer
StrataQuest contextual image analysis reveals how CD4+ T helper cells interact with their native tumor microenvironment in colorectal cancer, a leading malignancy in Europe.

Application Note
02 Nov, 2023
Quantification of Molecular Markers in 2-plex IHC
StrataQuest software quantified NCAM and Ki67 distribution in kidney cancer samples, demonstrating how 2-plex IHC staining can be applied to spatial analysis of tumor markers.

Application Note
15 Oct, 2023
Leishmaniasis parasite detection in cell culture and tissue: Leishmaniasis APP
Automated detection and quantification of Leishmania donovani parasites in cell cultures and tissue using the StrataQuest Leishmaniasis App, enabling identification of infected cells and parasite load per cell.
Application Note
01 Jun, 2023
Evaluating the Distance of Tumor Cells from Blood Vessels
Tumor growth depends on proximity to blood vessels. Using the IF Tumor Foci Angio App, researchers quantified tumor and non-tumor nuclei, vessel density, and distances of tumor cells from vasculature in brain tumor tissue, enabling advanced spatial analysis.
Application Note
27 Mar, 2023
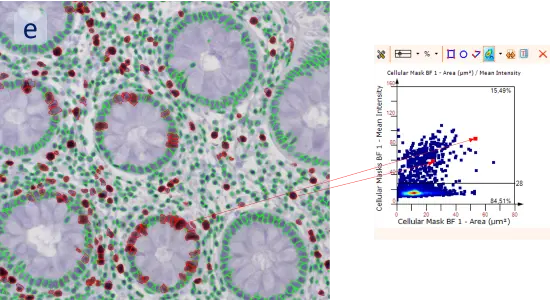
IHC 2 APP: Ki-67 Nuclear Staining Analysis
This case study demonstrates the use of StrataQuest’s IHC 2 App to quantify Ki-67 nuclear staining in colon tissue. The workflow enabled detection of total cell counts as well as the proportion of proliferating (Ki-67+) cells.
Application Note
14 Feb, 2023
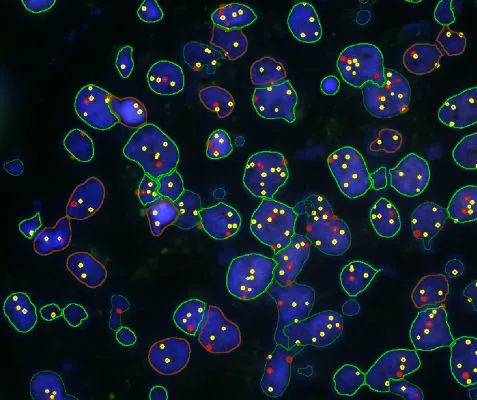
Case Study: Analysis of FISH Using Tissue Cytometry
The IF Dots App in StrataQuest streamlines automated analysis of FISH stainings by detecting nuclei and quantifying dots per cell. This case study shows how the workflow enables accurate, exportable data for genetics research and clinical applications.

Application Note
04 Oct, 2022
High-content quantitative phenotyping with 30 markers using Imaging Mass Cytometry
StrataQuest enables high-content image analysis of IMC datasets. This case study demonstrates single-cell and proximity measurements across 30 markers within one tissue section for comprehensive spatial phenotyping.