Explore the App Center
Explore our StrataQuest Apps and discover a wide range of biomedical image analysis solutions to inspire your research. If you don’t find the perfect fit for your needs, reach out to us — Our team of application experts are happy to support you by developing custom Apps tailored to your unique analysis requirements.
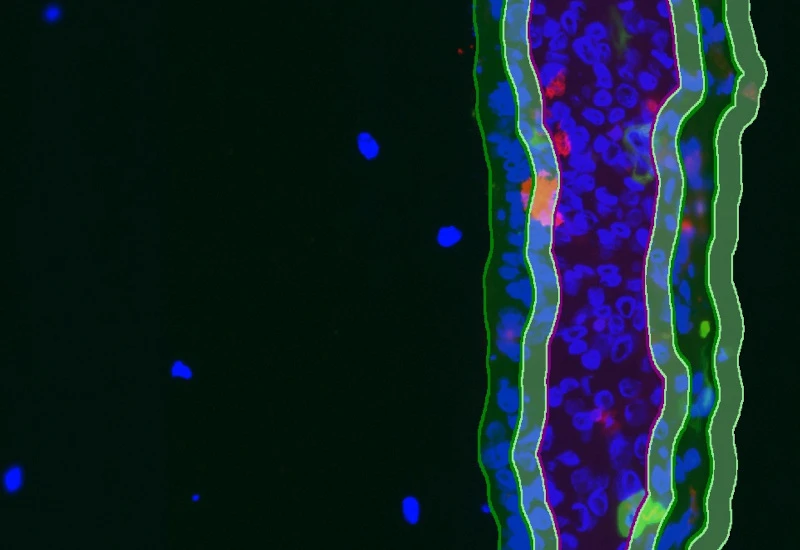
IF Artificial Skin
Stratify skin equivalents into dermis and epidermis, segment the stratum corneum, high/low suprabasal and basal layers, and quantify staining intensity, area, nuclei, and number/% of marker-positive cells for each layer.
dermatology, epidermis, dermis, skin, aging, oxidative UV damage, artificial skin

IF Cardio Cell Culture Dots
Segment cultured cardiac cells, detect cardiomyocytes and fibroblasts, and quantify dot markers (CISH/FISH) per cell, including cell counts and dot number, area, and mean intensity.
cardiology, cardiomyocytes, cell culture, fibroblasts, troponin red, FISH
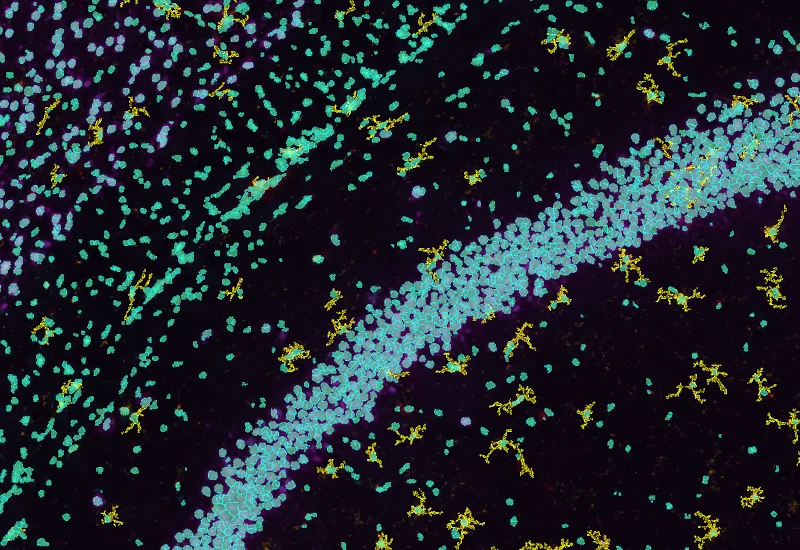
IF Brain App
Classify brain regions using an AI-based classifier and detect cellular phenotypes (e.g., astrocytes) based on markers, quantify tissue areas, total cells, and phenotype counts across regions.
brain, mouse, astrocytes, machine learning
IF 4
Analyze single-cell co-expression of four IF markers, segment cells into nucleus, perinuclear area, and/or cytoplasm, and export up to 20 intensity, statistic, and morphometric parameters.
co-expression, phenotyping, fluorescence, epithelial cells, immune cells
IHC Adipocytes+
The IHC Adipocytes+ App detects adipocytes and cellular aggregates between them. Outputs include number and area measurements for adipocytes and aggregates.
adipocytes, fat tissue, fat cells, immunohistochemistry, immune cell detection
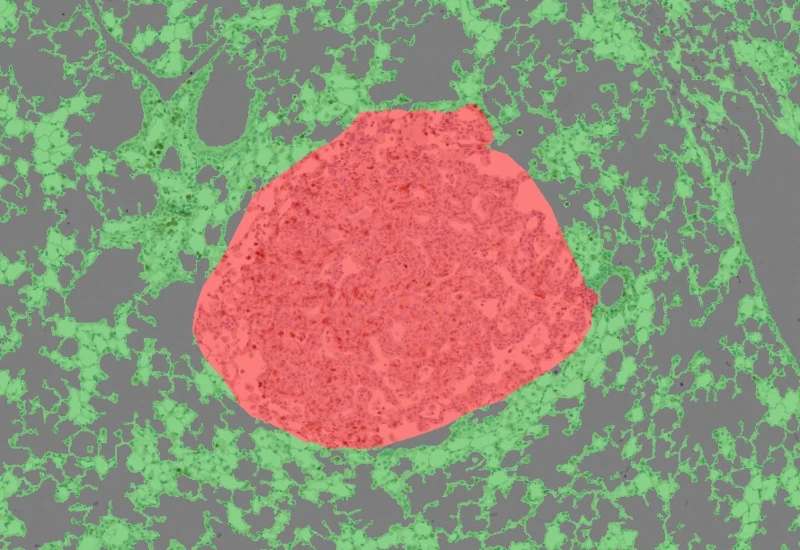
IHC Lung Cancer Mouse
Segment murine lung sections into tumor and non-cancerous tissue using a machine learning classifier, detect hematoxylin-stained nuclei, and quantify tumor area and marker-positive cellular phenotypes.
immunohistochemistry, lung cancer, tumor microenvironment, mouse, lung
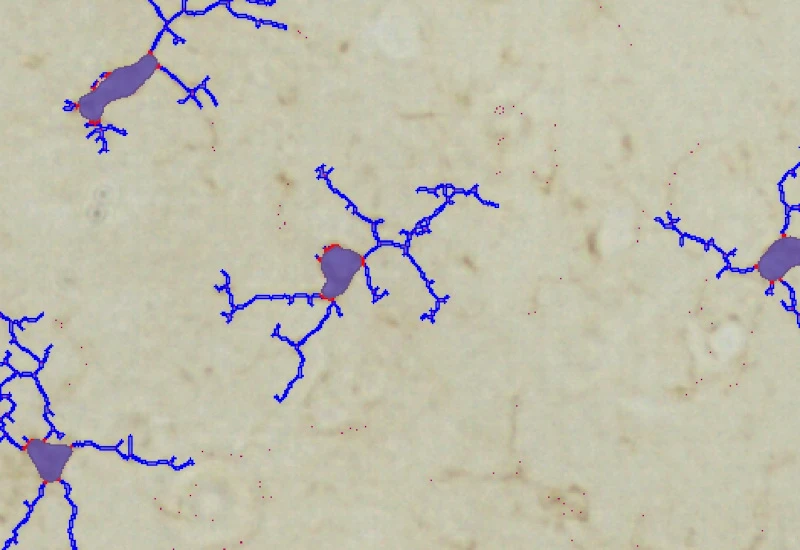
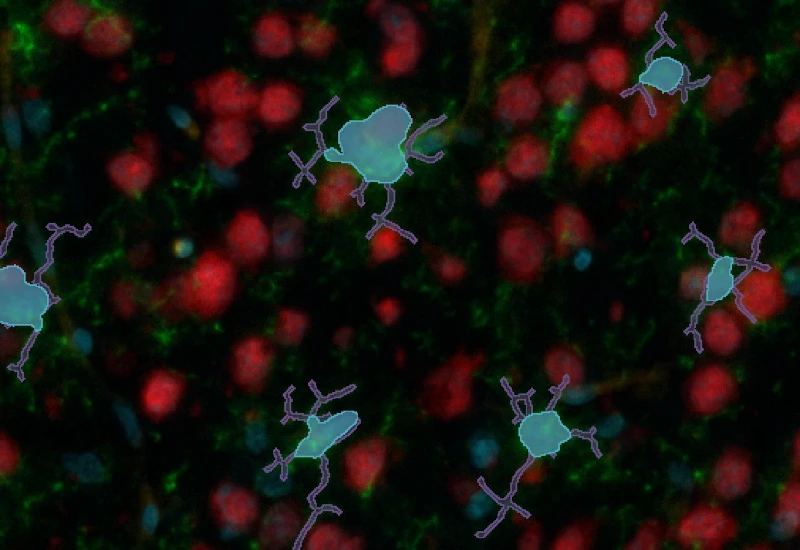
IHC Microglia
Detect microglia soma in IHC-stained samples, segment branches, and identify primary and secondary branching points to quantify cell morphology and branching complexity.
microglia, central nervous system, peripheral nervous system, phagocytosis, astrocytes, branches
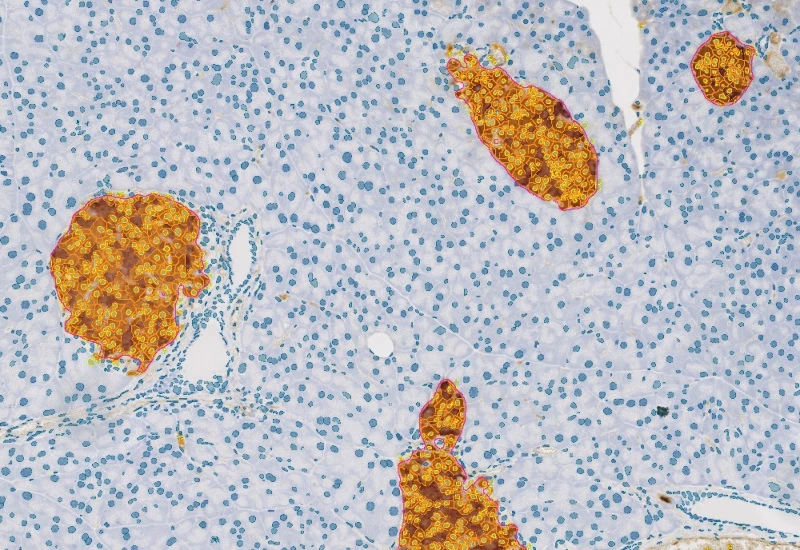
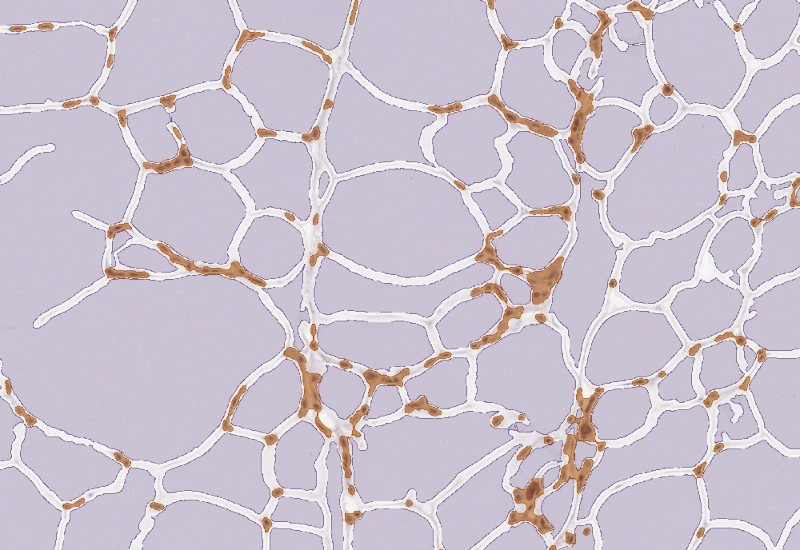
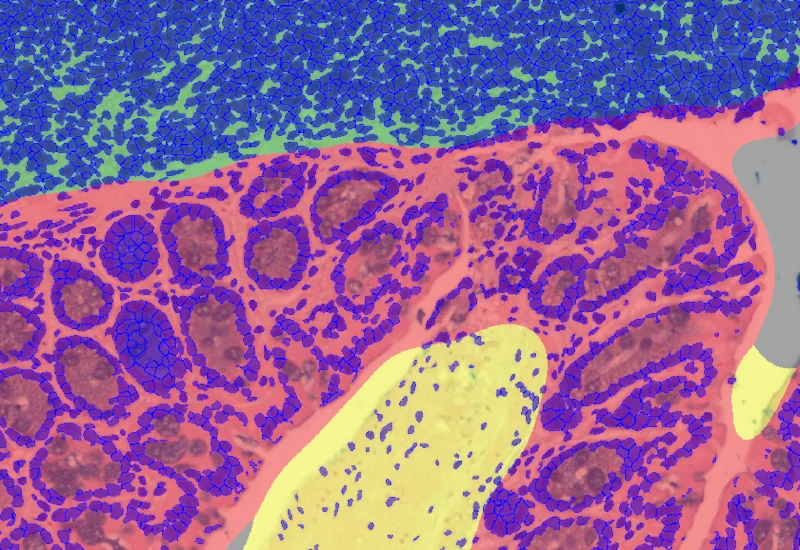
IHC Insulin Islets
The IHC Insulin Islet App detects marker-stained insulin islets, tissue area, and cell phenotypes within and outside the islets. Outputs include tissue and islet area, cell counts, and phenotype distribution.
insulin islets, pancreas, beta-cells
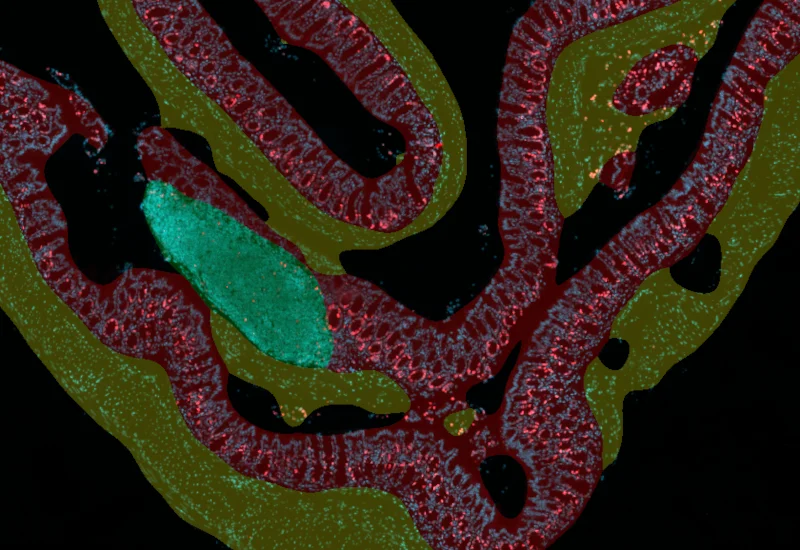
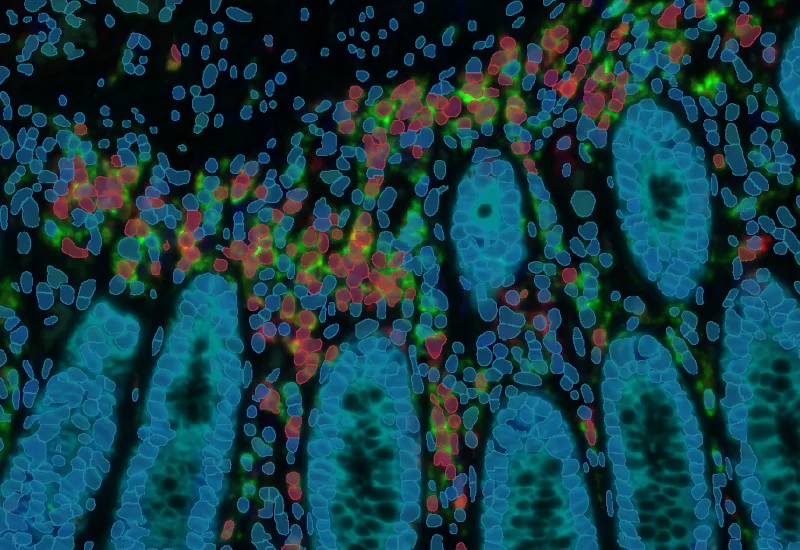
IF Swiss Roll
The IF Swiss Roll App segments tissue into subclasses (e.g., mucosa, follicles, connective tissue), detects nuclei, and identifies phenotypes via IF stains.
mouse, colon, fluorescence, immune cell follicles
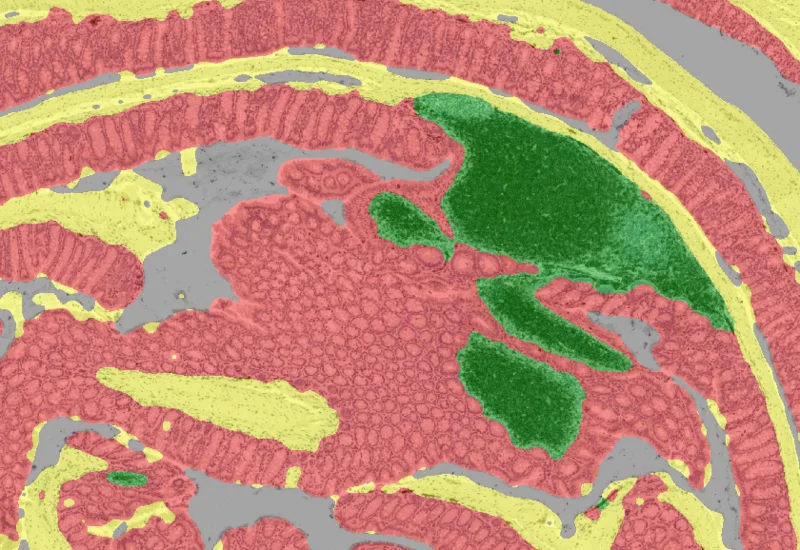
IHC Swiss Roll
The IHC Swiss Roll App segments the tissue into subclasses (mucosa, follicles, etc.), detects nuclei, and classifies phenotypes. Outputs include tissue areas, cell counts, and phenotype distribution per region.
mouse, colon, immunohistochemistry, immune cell follicles
IF Neuronal Cells
Detect neuronal cells and reconstruct neurites/dendrites, quantify primary and secondary branches, branching points, total cell area, branch length, and branch area.
neuronal cells, microglia, central nervous system, peripheral nervous system, phagocytosis, astrocytes, branches, fluorescence
Mucin Swiss Roll
The Mucin Swiss Roll App segments tissue into subclasses, detects nuclei and mucin (e.g. PAS-stained), and outputs tissue areas, cell counts, and mucin area per region and overall.
mouse, colon, mucin, immune cell follicles
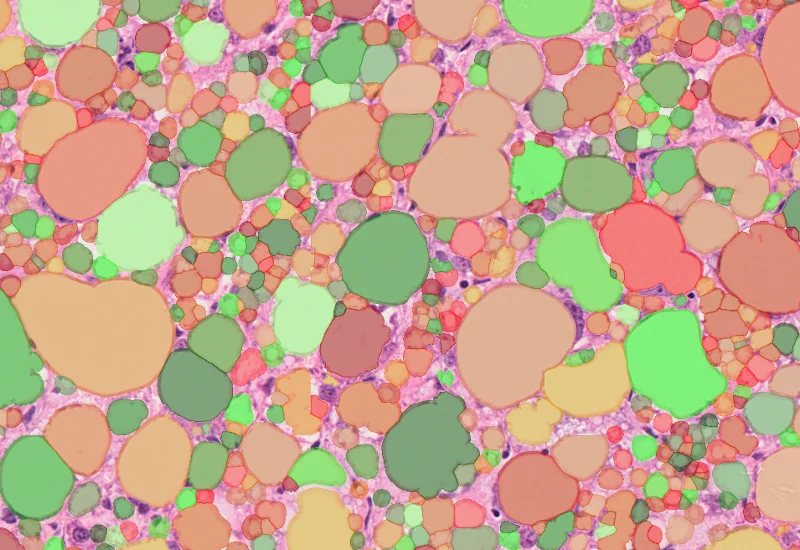
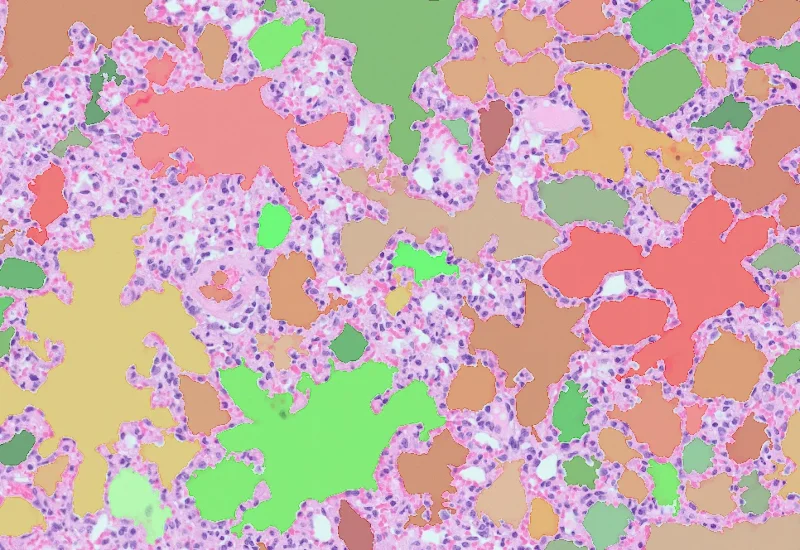
Lipid Droplets
The Lipid Droplets App quantifies lipid droplets in H&E-stained tissues, correcting membrane artifacts and providing counts and area measurements.
liver, lipid droplets, H&E, brightfield
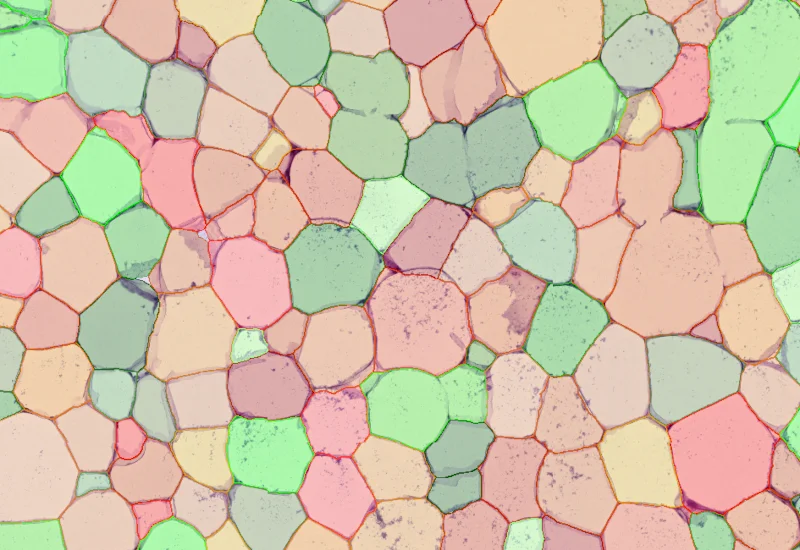
IHC Adipocyte
The IHC Adipocyte App quantifies adipocytes and their lumina in HE samples, correcting membrane artifacts and providing area measurements.
adipocytes, fat tissue, fat cells, H&E
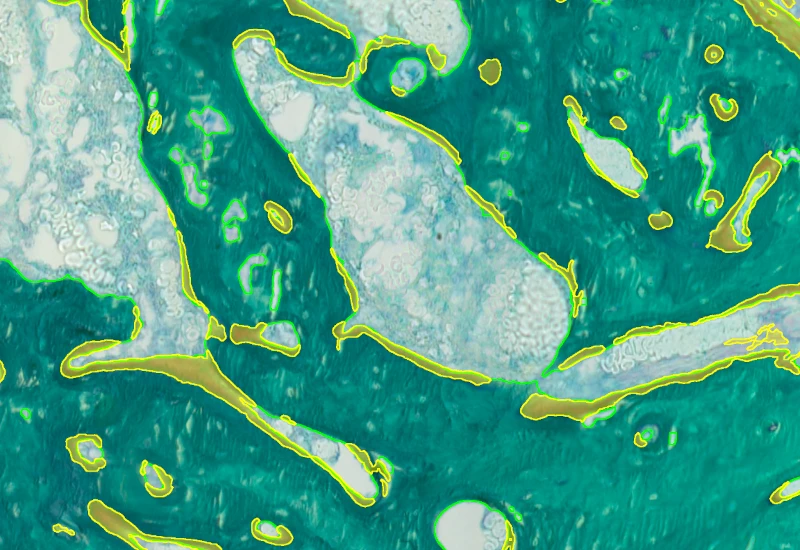
Bone Goldner
Detect mineralized bone and osteoid in Goldner-stained sections and measure BV, TV, OV, OV/BV, OV/TV, OS, BS, mean osteoid width, and mean osteoid thickness.
goldner staining, mineralized bone, osteoid, BV, TV, OV, OS, BS, brightfield
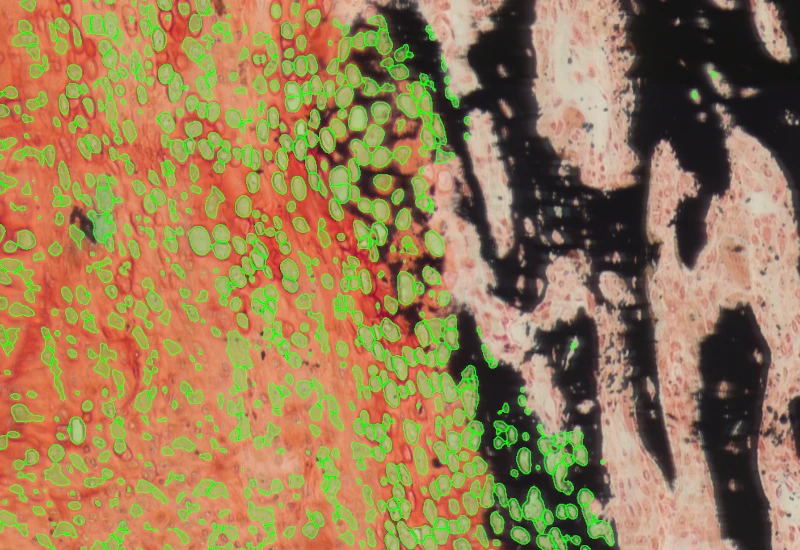
Bone Mineralization
Separate Safranin O–stained bone into cartilage, mineralized cartilage, bone marrow, and mineralized bone, and measure TV, BV, MCV, CV, and BM.
Safranin O, bone mineralization, bone marrow, cartilage, TV, BV, MCV, CV, BM, brightfield

Bone von kossa
Detect mineralized bone in von Kossa–stained sections and measure TV, BV, BS, BV/TV, BS/BV, Tb.N, Tb.Th, and Tb.Sp.
mineralized bone, bone research, von kossa, osteoporosis, brightfield
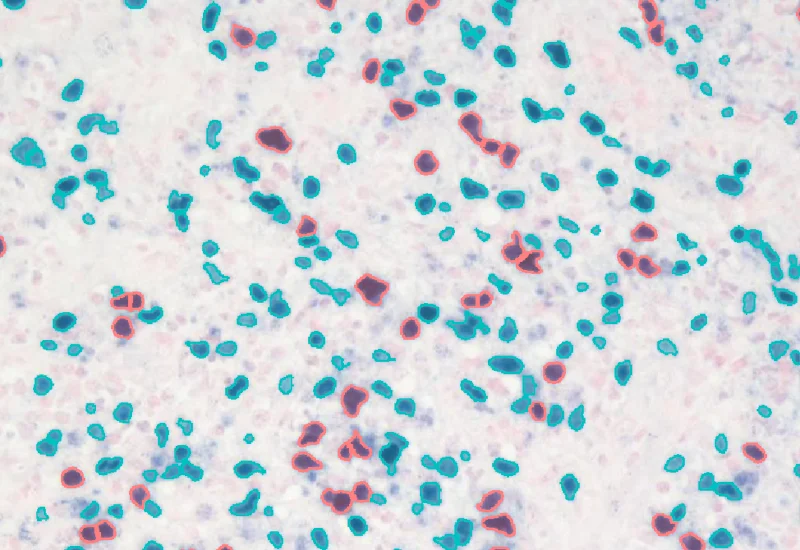
EBER-ISH
Detect nuclei and identify EBER-ISH–positive cells in EBV-stained tissue, and quantify total cell number, and number, density, and percentage of positive cells.
EBER-ISH probes, Epstein-Barr virus (EBV), infection
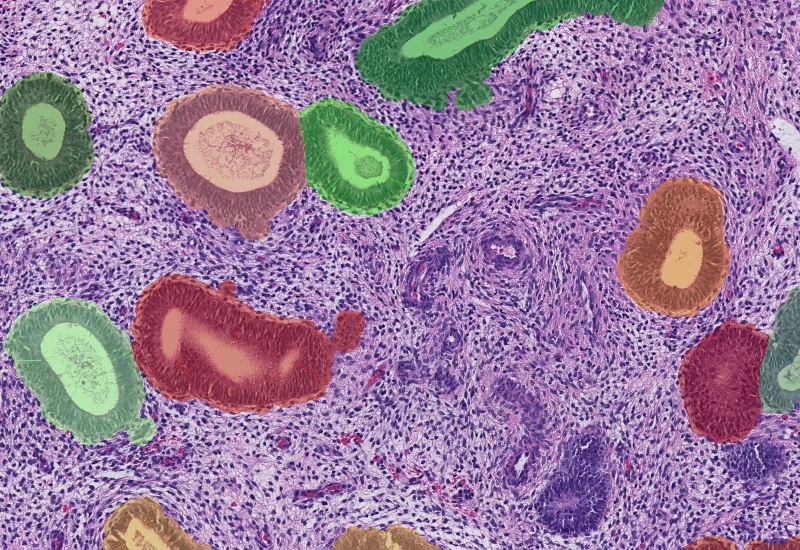
Endometrium Morphology
Segment H&E-stained endometrium into glands, stroma, and blood vessels, and quantify the area of each morphological entity.
endometrium, endometriosis, H&E, glands, blood vessels, stroma, gynecology