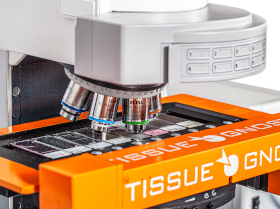
TissueGnostics provides fully integrated cutting-edge tissue cytometers for (i) whole-slide imaging (brightfield, fluorescence, confocal, multispectral) and (ii) high-end analysis of tissue sections, cultured cells, TMAs, smears etc. Explore TGs solutions for spatial phenotyping, single cell analysis, molecular single cell profiling, machine-learning based tissue classification and many more.
REDI Fellow Jyotsna Batra successfully completes her fellowship with TissueGnostics to battle prostate cancer.
Testimonial Jan Soetart
Jan Soetaert
The addition of the TissueFAXS i PLUS to our core facilities’ repertoire has made a world of difference to the ease of data collection and processing. The acquisition software is remarkably well-designed, offering extreme flexibility without compromising on the robustness and ease of use for the whole system.
TissueGnostics joins the European conversation about re-use of health data
HELICAL: HEalth data LInkage for ClinicAL benefit is a Marie Sklodowska-Curie innovative training network comprising 17 academic and 9 non-academic/industry partners for early stage researchers in the field of Healthcare Data Linkage in the machine learning and GDPR era. HELICAL exploits recent advances in data science to link research datasets with longitudinal healthcare records, based on the robust ethical foundation required for linkage studies using near-patient data, to address key experimental questions.
Joint Webinar - De Novo Software and TissueGnostics
Advancing Tissue Cytometry from Image to Results with TissueGnostics and FCS Express - TissueGnostics and De Novo Software started to collaborate by combining expertise in Image Cytometry.
APR
14. April 2021
Immunophenotyping of Tissues Using Digital Techniques
What is Immunophenotyping? Immunophenotyping refers to the identification of specific phenotypic cells using markers or antigens which are present on the cell’s surface, cytoplasm, or within the nucleus. It aids the classification of cell lineage using antibodies targeting specific markers or antigens on the cells. Immunophenotyping can be used to diagnose various types of diseases including cancer by comparing normal cells with cancer cells in suspension (i.e. leukemias) or tissues (i.e. solid cancers).
Types of Immunophenotyping In immunophenotyping, two types of tests are used: flow cytometry for fluid suspension samples and immunohistochemistry for cells as well as tissue sections on slides. Flow cytometry is used to analyze single cells in suspension including bone marrow, peripheral blood samples or dissociated tissues. It is a fast and reliable method of immunophenotyping which can be used to detect infrequent hematological malignancies, clonality in B-cell lymphomas and other disease-specific cellular phenotypes with ease. Flow cytometry can measure cell size, cell granularity, total DNA, surface and intracellular proteins and therefore is an extremely powerful method for immunophenotyping. The only disadvantage is that cells are analyzed in suspension and valuable information in respect to their native tissue context is lost. Immunohistochemistry involves the staining of tissue sections, smears, TMAs, or cultured cells on slides. Immunophenotyping can be performed with tissue cytometers, the workflow includes the whole slide scanning of tissue sections and the follow up analysis of single cellular phenotypes in tissue context.
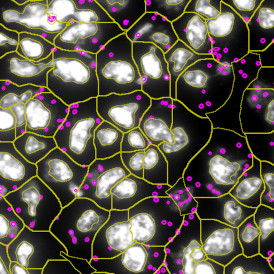
Immunophenotyping solutions from TissueGnostics The TissueFAXS® platform is a next-generation tissue cytometer. It couples the advantages of innovative high-resolution IF multi-channel microscopy and automated whole slide imaging with the analytical accuracy of flow cytometry immunophenotyping. The big advantage of this is that tissue context is still available while whole slide images – digitized slides – can be easily shared and discussed with colleagues via telepathology. The TissueFAXS® tissue cytometer is successfully employed in various research fields including cancer, pathology, developmental biology, immunology, urology, dermatology, and drug development. It satisfies the demands of each of these disparate analytical fields through its extreme modularity. Although based on the same platform, TissueFAXS® cytometers feature integrated solutions that enable unique functionality for critical aspects of study. The TissueFAXS Qcomes with a high-tech spinning disk unit for widefield or confocal imaging using a single physical disk. The TissueFAXS PLUS, meanwhile, is equipped with an 8-slide stage used to scan samples in both brightfield and fluorescence modes. Each of these platforms is modular and upgradeable to meet the changing demands of your research area. At TissueGnostics, our analysis algorithms typically begin with single cell assessment which requires a master channel, usually DAPI fluorescent stain. Nuclei are then segmented using a contour overlay which enables the measurement of relative staining intensity for markers both inside and outside the nucleus. Using these measurements as our baseline we can also identify multicellular objects in tissue for detecting more precise, tissue contextual data. If you would like to learn more about immunophenotyping solutions from TissueGnostics, contact us today.
Webinar - Tissue Cytometry assisted Metabolic Imaging in Skin
Prof. Florian Gruber and Christopher Kremslehner, MSc from Medical University of Vienna introduce their newly developed Metabolic Imaging strategy published in the journal Redox Biology. TissueFAXS i PLUS and StrataQuest are integrated into the presented Metabolic Imaging workflow, through which they are able to analyse immediate effects of UV light on skin.
15 JUL
15. July 2021
What is Whole Slide Confocal Imaging?
Whole slide imaging, sometimes known as virtual microscopy or digital pathology, involves the scanning of a tissue section on a slide to create a digital reconstruction of the entire tissue section by stitching the single fields of view together. It has an enormous impact on pathology as many diseases rely on the visual diagnosis of slide specimens. Visual examination can be carried out on digital slides instead of using physical samples, without compromising the accuracy of results. This enables the flexibility associated with fully-portable digitized information, and the possibility to easily implement telepathology as well as automated image recognition procedures.
Whole Slide Imaging with Confocal Microscopy Traditionally, whole slide imaging has been performed with slide scanners that use a camera to take multiple images of different sample areas that can then be reconstructed to form the digital image of the full specimen. As long as the scanning speed of the microscopy technique of choice is sufficient, whole slide imaging methodologies can be used with a variety of different microscopy techniques and imaging methods. One possibility is to use confocal microscopy for acquiring whole slide images of IF processed tissue sections. Confocal microscopy has several advantages over fluorescence widefield optical microscopy techniques for examining pathological specimens as it enables the use of spatial filtering techniques to eliminate contributions from out-of-focus light or inhomogeneities in sample thicknesses that would lead to image degradation.
How Does Whole Slide Confocal Imaging Work? There are a variety of strategies for scanning confocal microscopes, including single-beam and multi-beam approaches. This can be used to cover larger areas of the specimen of interest in the XY plane but also to profile samples vertically. This makes it possible to image sub-micrometer-thick slices through the sample that can later be vertically restacked, giving a full three-dimensional whole slide confocal image. The ability to visualize volumetric spatial reconstructions of tissue means that confocal imaging can be used to display even complex cell nuclei where there are signals of different colors arising from multiple targets of interest. As scan times can be relatively long, the automated nature of whole slide confocal imaging is highly appealing, making the technique much more practical for recovering a wealth of information on cell structures.
Whole Slide Confocal Imaging with TissueGnostics TissueGnostics offers the TissueFAXS Q series, which is perfectly designed for performing whole slide confocal imaging. At the heart of the unit is a spinning disk system which can be used for both confocal imaging and widefield imaging by letting the light path bypass the disk. By combining this with a highly sensitive sCMOS camera, it is possible to perform whole slide confocal imaging on up to 120 slides at a time. The TissueFAXS imaging software is what drives all hardware components, which together produce high resolution Z-stacked images, and can enable extended focus on whole slide confocal images. These virtual slides can then be used for context-based quantitative analysis using TissueGnostics StrataQuest software. As StrataQuest comes with compatibility for a growing number of Apps, the TissueGnostics platform allows you to take full advantage of the power of virtual microscopy. From automated, high-throughput slide imaging, to data organization and distribution and ultimately, automated analysis for speeding up and enhancing your research, TissueGnostics’s platforms offer ample opportunities to realize the full potential of whole slide confocal imaging. Interested in learning more about whole slide confocal imaging solutions? Contact a member of the TissueGnostics team today.
White Paper - Redefine the Transcriptional and Epigenetic Signature of Tissue-Associated Regulatory T Cells
Recently Delacher and colleagues were able to redefine the transcriptional and epigenetic signature of tissue-associated regulatory T cells (Treg) in mice and humans (Delacher et al. 2021). They could demonstrate, that Treg cells from healthy tissues share distinct expression patterns with tumor-infiltrating Treg cells.
High resolution microscopy relies heavily on efficient confocal slide scanners to accurately and speedily image markers/target components within cells. Confocal slide scanners ensure high resolution visualization of fluorescent biomarkers within cell and tissue structures, a crucial technique in biomedical research. This blog post will review the specifications and request for quotes (RFQs) for products with confocal slide scanners from the product line TissueFAXS Q by TissueGnostics, a leading expert in tissue cytometry.
Specifications of Confocal Slide Scanners in Products TissueGnostics provides detailed specifications of confocal slide scanners in the TissueFAXS series of tissue cytometers optimized to meet a wide variety of confocal slide scanning needs. TissueFAXS is compatible with TissueGnostics StrataQuest, an image processing solution capable of advanced digital contextual image analysis for confocal microscopy in tissue studies. Confocal slide scanners can be included in multiple products from the TissueFAXS line. For example, the TissueFAXS Q and SL Q Systems are equipped with LED utilizing, fast whole slide confocal imaging of standard as well as oversized slides. With LED-based technology, multi-channel fluorescence imaging, and a slide ID scanner, this confocal tissue cytometer results in high-speed and high-resolution confocal imaging. The upgraded SLQ version performs high throughput scanning of up to 120 slides to boost process speed and efficiency. Using a confocal spinning disk that rotates at 15,000 RPM, TissueFAXS Q delivers automated scanning abilities with slides easily visualized automatically. Customizable scanning templates are also offered for efficient batch scanning. The basic tissue cytometer offered by TissueGnostics, the TissueFAXS Plus performs widefield fluorescence and brightfield scanning and is also available in a scan-only configuration. Compatible with oversized slides, it can easily be upgraded to confocal scanning capabilities. Additionally, the TissueFAXS SL (Slide Loader) can also be upgraded to configurations suitable for confocal slide scanning. Thus, there are a variety of ways to implement advanced confocal slide scanning capabilities into your laboratory. Please see the section on submitting RFQs if you are interested in upgrading any existing TissueFAXS products.
Submitting RFQs for Confocal Slide Scanners RFQs need to be submitted for confocal slide scanners on TissueGnostic products to ensure scanner capabilities are customized to best perform for clients’ specific expectations. Request for quotes (RFQs) for confocal slide scanners can be submitted on the online form on our contact page requiring contact information and a brief description of the intended confocal slide scanner use. A member of our team will then contact you about your product RFQ.
Whole Slide Confocal Imaging with TissueGnostics TissueGnostics offers the TissueFAXS Q series, which is perfectly designed for performing whole slide confocal imaging. At the heart of the unit is a spinning disk system which can be used for both confocal imaging and widefield imaging by letting the light path bypass the disk. By combining this with a highly sensitive sCMOS camera, it is possible to perform whole slide confocal imaging on up to 120 slides at a time. The TissueFAXS imaging software is what drives all hardware components, which together produce high resolution Z-stacked images, and can enable extended focus on whole slide confocal images. These virtual slides can then be used for context-based quantitative analysis using TissueGnostics StrataQuest software. As StrataQuest comes with compatibility for a growing number of Apps, the TissueGnostics platform allows you to take full advantage of the power of virtual microscopy. From automated, high-throughput slide imaging, to data organization and distribution and ultimately, automated analysis for speeding up and enhancing your research, TissueGnostics’s platforms offer ample opportunities to realize the full potential of whole slide confocal imaging. Interested in learning more about whole slide confocal imaging solutions? Contact a member of the TissueGnostics team today.
Personalized Medicine: TissueGnostics majorly contributes to a dossier
On October 5th 2018 the Austrian Medianet magazine published a health economy dossier on Personalized Medicine. Medianet has the largest reach of all Austrian trade journals and is mainly read by managers, decision makers and stakeholders in the Austrian economy.
We are proud to announce that TissueGnostics is now an industry partner of the European Assciation for Cancer Research (EACR).
MAR
03. March 2021
Webinar - In-situ Immunophenotyping in graft-versus host disease
Dr. Johanna Strobl, PhD, from the Medical University of Vienna, Austria, talks about her recently published study addressing host-derived skin-resident memory T cells as potential players in human graft versus host disease.
20 MAY
20. May 2021
Tissue Cytometry Vs. Flow Cytometry: What's the Difference?
Cytometric methods are used by biomolecular researchers looking for insights into cell size, count, cycle, and morphology. They are also used to measure key cellular constituents (i.e. DNA content). The broad goal of cytometry is to obtain extremely specific data from individual cells. This is predominantly achieved using flow cytometry, the cytometric workhorse of life sciences. However, despite its widespread implementation in research applications, flow cytometry is not the only tool available for detailed cellular analysis. Tissue cytometry is a novel approach to cellular imaging that allows researchers to measure and analyse cells in the context of their biomolecular environment. Flow cytometers use complex fluidics systems to measure cells in solution one-by-one, as they pass through the laser intercept in single file. By contrast, tissue cytometers are based on high-resolution light microscopy and use a solid tissue section rather than single cell suspensions.
How Flow Cytometers Work Flow cytometers comprise three primary components: 1. Fluidics: The fluidics system forces labelled cells in a single-cell suspension into a core stream which passes through the instrument for analysis. 2. Optics: The optical system includes an array of excitation light sources and filters, foremost of which is the laser intercept comprising a perpendicular beam of monochromatic light which is either scattered or absorbed. 3. Electronics: Forward scattered light, side scattered light, and fluorescence emission signals are acquired by photodetectors and digitized for subsequent analysis.
How Tissue Cytometers Work Tissue cytometry applies the basic imaging principles of flow cytometry to the tissue sections on slides. The TissueFAXS platform – currently the best-in-class tissue cytometer available – is based on high-end imaging hardware comprising a microscope, scanning stage, fluorescence excitation devices, cameras for detection, software enabling scanning automation, and quantification software. Varied sample types can be used, including cell culture monolayers on various substrates, cryo-cut sections, paraffin-embedded tissue, and so on. Standard staining protocols apply to each, using several markers to achieve the same phenotypic characterization typical of flow cytometry but within the native tissue environment. The benefits of this are multifaceted. So, what do these differences mean in practice and when might you consider deploying tissue cytometry instead of conventional flow cytometry?
Benefits of Tissue Cytometry Tissue sections comprise a great variety of cells including epithelial cells, muscle cells, nerve cells, blood vessels, tissue infiltrating leukocytes and maybe tumor cells at various differentiation stages. In a single cell suspension, much of this morphological detail and diversity is lost. Tissue cytometry provides a better indication of critical cellular and spatial interactions in their normal context. Tissue cytometers are not only assessing basic properties such as cell diameter or shape and are instead quantifying multiple molecular marker expressions across a whole slide. This way they can also provide a much greater depth of insight into the functional characterization of single cells and their interactions with other morphological substructures.
Interested in Tissue Cytometry? TissueGnostics is the industry-leading manufacturer of tissue cytometry solutions for histology and precision medicine applications. We offer a range of TissueFAXS tissue cytometersfor whole slide and high-resolution confocal imaging with a choice of configurations and built-in automation systems to support easy onboarding in any setting. Want to learn more? Contact a member of the TissueGnostics team today.
Dr. Kim RM Blenman, Yale School of Medicine, USA, presents ’The spatial dynamics of the human tumor immune microenvironment (TIME)' at the EACR Congress 2021 (TissueGnostics sponsored Industry Symposium).
TissueGnostics is proud to announce a new member of the TissueFAXS series, the TissueFAXS CHROMA. This system specializes in automated multispectral fluorescence whole slide scanning for up to 7 markers at a time. This cost-effective high-speed slide scanner reaches its full potential when combined with TG’s single cell and contextual image analysis solutions.
07 OCT
07. October 2021
Webinar - Characterization of the foreign body reaction to polypropylene surgical meshes in the human abdomen
Dr. Axel Dievernich (RWTH Aachen) presents the results of his recently published paper. It addresses the characterization of the adaptive and innate immune cells involved in foreign human body reaction.
25 OCT
25. October 2021
Prognostic and Predictive Biomarker Detection in Colorectal Cancer
Colorectal cancer is uncontrolled and is therefore pathological cell growth originating either within the colon or rectum of the body. One of the most common types of cancer, colorectal cancer, made up almost 2 million new diagnoses in 2018, according to a study published in the journal Cancers. Due to the prevalence of this cancer, medical researchers and health care providers rely on histopathology to provide data about a patient’s disease and then offer a prognosis on the most effective treatment strategy. In order to form a prognosis, predictive biomarkers of the disease are detected in patients. The method of biomarker detection will be further explored in this blog post.
What is Biomarker Detection? Biomarker detection involves identifying a biological molecule in human samples which indicate the nature of specific processes occurring in the body. Biomarker detection can be used to sense the presence or even the severity of a disease. Biomarkers can target genetic information, enzymes, proteins, and transcription factors. By identifying biomarkers in patients, doctors can diagnose diseases earlier and determine the best course of action to treat them. Biomarkers can also give insight into how effective treatments will be for patients so that healthcare workers can cater individualized therapies to ensure the best performance for each person.
How to Perform Biomarker Detection? Powerful and effective biomarker detection techniques are crucial to providing accurate and timely disease prognosis and predictions. Various methods are used for biomarker detection. Image analysis and quantification of biomarker expression are useful for histopathological cancer studies. Technologies like tissue cytometry can provide high performing biomarker detection through advanced visualization and cell quantitation capabilities.
Applying Biomarker Detection to Colorectal Cancer Research A recently published research paper employed biomarker detection to determine the prognostic and predictive value of cell densities containing the transcription factor SOX2+ in colorectal cancer patients. As SOX2 plays a role in cell differentiation and possesses stem cell-like properties, researchers chose it to be evaluated as a potential biomarker for patient responsivity to chemotherapy treatments. After immunostaining, the cell densities of SOX2+ were quantified using StrataQuest digital imaging analysis. The study found that SOX2+ is not a predictive biomarker that can be used for prognosis for whether patients will respond positively to colorectal cancer treatments.
Biomarker Detection with TissueGnostics Tissue Gnostics offers the TissueFAXSseries of tissue cytometers specifically designed to image and screen potential biomarkers. For example, the TissueFAXS CHROMA is a high-speed multispectral tissue cytometer capable of high resolution multispectral fluorescence imaging for up to seven biomarkers. TissueFAXS is compatible with TissueGnostics StrataQuest, an image processing solution capable of advanced digital image analysis for biomarker detection. As a leading expert in tissue cytometry, TissueGnostics promises clients a streamlined, efficient procedure with the many benefits of the aforementioned products described in more detail online. TissueGnostics is a pioneer in tissue cytometry, offering the ability to engage in the many possibilities of biomarker detection. If you are interested in learning more about biomarker detection solutions, please do not hesitate to contact a member of the TissueGnostics team today.
TissueGnostics Co-organizes Microscopy Image Cytometry Symposium in São Paulo, Brazil
On March 12-14, 2020 TissueGnostics co-hosted a symposium on tissue cytometry and high dimensional data analysis in collaboration with the São Paulo Cancer Center.
FEB
25. February 2021
A Brief Introduction to Automated Tissue Classification
What is Tissue Classification? Tissues are groups of cells in close proximity to one another which are organized to carry out one or more specific functions. There are four tissue classifications which are characterized by their morphology and function. These categories are; connective tissue, which underlies and supports other tissue types; nervous tissue, which transmits and integrates information across the central and nervous systems; epithelial tissue, which forms protective boundaries and is involved in the diffusion of ions and molecules; and muscle tissue, which contracts to facilitate movement in the body. Tissue classification is the process of categorizing an unknown tissue sample into one of these categories, the ways in which these samples can be categorized will be described in this article. Connective tissue classification is centered around the composition of its cellular and extracellular elements and the internal bodily function. Tissues are either classified as proper, embryonic, or specialized. Connective tissue is the most abundant tissue classification found in the human body. Epithelium forms the covering of surfaces of the body. It has many purposes such as, adsorption, excretion, protection, filtration, and sensory reception. Epithelium fit closely together to form sheets of cells and are supported by connective tissue.
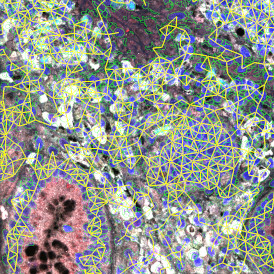
How is Tissue Classification Carried Out? Traditionally, tissue classification is carried out via pathologist inspection of biopsy slides. Historically this has been the only way to get an accurate diagnosis, however there are now less pathologists working and more tissue classifications that need to be carried out. This is causing turnaround times to exceed standards. Using experts for classification can also result in discrepancies between practices of pathologists. High-resolution microscopy images or whole slide scans of tissue specimens offer comprehensive information about the morphology of normal and diseased tissue and are the basis for high-content image analysis. Tissue classification is a common task in tissue image analysis, however fully automated algorithms for tissue classification can be difficult to implement due to the complexity and heterogeneity of tissue morphology. Automated tissue classification has achieved high levels of accuracy and tissue cytometers can be used to carry out tissue classification This brings the same type of phenotypical and functional analysis which is used in flow cytometry (FACS) into the context of tissue on the level of single cells.
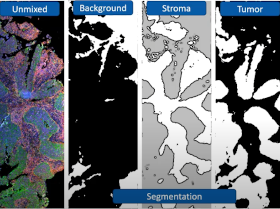
Tissue Classification Solutions from TissueGnostics TissueGnostics is a solution provider for precision medicine and next-generation digital pathology, offering fully integrated, cutting-edge tissue cytometers. TissueGnostics’ fully automated machine learning based tissue classificationsystem works by marking a small number of areas representative for the morphological entities in question (i.e. tumor, stroma, epithelium, glands)) inlcuding the background. These defined areas will allow the classifier to separate the tissue into individual tissue classes, including the background and will generate binary masks for the detected areas. These classifying masks can be examined further by single cell analysis for high-content phenotyping including spatial analysis. For more information about tissue classification from TissueGnostics, please contact ustoday.
Webinar - Practical approaches for using tissue cytometry for clinical and research applications
In this webinar Dr. Kim RM Blenman, Yale School of Medicine, USA, presents her integration of TissueGnostics’ tissue cytometers and the contextual image cytometry software StrataQuest in a unique in-silico multiplexing workflow.
18 MAY
18. May 2021
CALL FOR PAPERS – Frontiers in Medicine
Dr. Rupert Ecker, CEO, and Felicitas Mungenast, Product Specialist at TissueGnostics, are privileged to edit a Special Issue ‘Current Advances in Precision Microscopy’ of the journal Frontiers in Medicine together with Prof. Jyotsna Batra and Dr. Quan Nguyen.
06 JUL
06. July 2021
White Paper - Evaluating the Nature of Immune Responses to Implanted Polypropylene Mesh
Surgical mesh is used in a range of tissue repair procedures to stabilize and strengthen soft tissue defects or to support prolapsed organs and viscera. One of their most common applications is hernia repair. The mesh serves to mechanically strengthen the weakened area while simultaneously providing a scaffold to support the growth of new tissue, which expands through pores in the mesh and eventually surrounds it.
12 JUN
12. June 2023
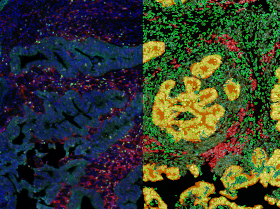
White paper: Activated Erk 1/2 Kinases Decrease Cell Viability Caused by Erastin in HNSCC
The study correlated xCT activity in HNSCC cancer samples within the cell with patient survival rates to determine whether this molecule can serve as a potential therapeutic target in HNSCC patients. TissueFAXS was used to automatedly scan slides with tissues stained for hematoxylin and xCT. HistoQuest was utilized to quantify xCT expression within single cells based on its signal staining intensity.
30 SEP
30. September 2021
Upcoming Webinar Series with Precipoint
TG is hosting together with Precipoint an exiting webinar series entitled "From Tissue Classification to Proximity Measurement". The purpose of this webinar series is to explain AI software to new and upcoming AI users in the context of pathology research.
MAR
25. March 2020
TissueGnostics introduces Global Alliance Against Pandemic Virus Threats Campaign!
We pledge to provide up to 5 MILLION EURO of the company’s award-winning IMAGE CYTOMETRY SOFTWARE at “NO COST” in support of researchers around the world who are fighting to win this battle with SARS-CoV-2 / COVID-19. ...Sign Up Here
MAR
18. March 2021
Next-Generation Image Analysis Software for Digital Pathology
What is Digital Pathology? Digital pathology refers to the acquisition, management, sharing, and interpretation of information relating to pathology, such as data and slides, in a digital medium. Glass slides are captured with a scanning device to create digital slides offering high-resolution images which can be visualized on computer screens or portable devices. Digital pathology is becoming more and more widely accepted across the field of pathology. Its usage has led to employed static images, live streaming of images, and whole slide imaging (WSI). Whole slide imaging means that the entirety of a glass slide can be digitized, meaning pathology has become decentralized and does not need to be tied to a traditional microscope. Digital pathology can be used in clinical applications such as making pathological diagnoses, telepathology, archiving, and image analysis. It can also be used in non-clinical applications such as research and education.
The Future of Image Analysis Software for Next-Generation Digital Pathology Image analysis is a key component of the evolving field of next-generation digital pathology and a large number of life science applications. Analysis applications which need segmentation to extract targets (such as cells and biomarkers) from the image are commonplace.
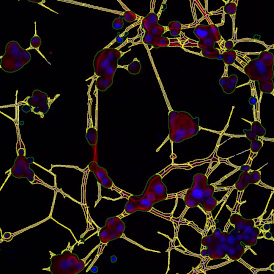
Multicellular & Single Cell Segmentation The new image analysis suite from TissueGnostics includes deep-learning based nuclei segmentation and a machine-learning based tissue classifier which means users can, with minimal input, train the system rapidly to detect both multicellular objects and single cells automatically. This enhances the accuracy and speed of the detection of label-free objects, quantitative analysis of cellular phenotypes and segmentation built on morphological features in digital pathology.
Brightfield & Fluorescence Imaging Conventional nuclei segmentation built upon classical image analysis methods is prone to fail in tissue environments exhibiting extreme cellular density. Cells within primary and secondary lymphoid organs or immune cell clusters can be particularly difficult to accurately segment. Another frequently encountered challenge for accurate nuclei segmentation is weak nuclei staining as well as non-homogenous chromatin distribution patterns within nuclei. Our deep learning-based nuclei segmentation algorithm overcomes those challenges. Machine learning-assisted image analysis software is able to identify multicellular structures in both fluorescence and brightfield images. Combining machine learning for tissue classification with a completely automated deep learning-based nuclei segmentation greatly enhances the speed and accuracy of the quantitative analysis of the tissue sample. By marking just a few areas representative for the specific morphological entities of interest (tumor area, tumor-stoma, blood vessels, immune cell clusters etc.) a model is created which can separate the tissue into the given classes, and will automatically generate binary masks for the detected areas. To increase the spatial context to these kinds of analysis, tissue class-specific parameters including area, cell count, and percentage of marker-positive cells can be further assessed. Next-generation digital pathology benefits significantly from integrating machine and deep learning assisted analysis to increase reproducibility while also reducing user input. To find out more about TissueGnostics next-generation digital pathologysolutions, contact ustoday.
Machine Learning Tissue Classifier from TissueGnostics
Healthcare systems stand to gain much from the application of artificial intelligence and machine learning algorithms. Currently, these cutting-edge technologies are deployed in medical applications in a fairly limited way; usually to complement the abilities of healthcare and surgical specialists. Deep learning software is typically used to expedite the analysis of visual data like computed tomographs (CTs) or histopathological imagery as medical professionals can easily validate findings that have been algorithmically derived. Although machine learning has the potential to integrate extremely complicated data for in-depth diagnoses, their complex statistical structures may represent an issue of transparency which can make it difficult to meet regulatory standards.
Machine Learning Tissue Classifiers: Driving AI in Diagnostics Machine learning tissue classifiers are among the most attractive AI-enhanced clinical solutions with feasible short-term applicability. They are powerful tools for all forms of tissue classification, providing data-driven insights into the morphology of diseased and healthy tissues alike. Additionally, the best machine learning tissue classifiers are equipped with intelligible algorithms that simultaneously provide more accurate detection of nuclei in difficult conditions while avoiding convoluted statistical structures. Convoluted neural networks (CNNs) have parameters that are difficult to explain, thus it is difficult to ensure regulatory compliance when using CNN-based diagnostic systems. At TissueGnostics, we have engineered a machine learning tissue classifier which can be combined with other algorithms integrated into the contextual image analysis software StrataQuest. One exceptional feature of the 7th generation StrataQuest package is a simple Deep Neural Network (DNN) designed for precise nuclear segmentation in challenging tissue environments including: • Extreme cellular density • High variation in nuclei size/texture • Weak signal intensities
How Do Machine Learning Tissue Classifiers Work? This depends on the software, so our answer to this question is exclusive to TissueGnostics’ machine learning tissue classifiers equipped with StrataQuest 7 software. Our machine learning tissue classifier operates by highlighting the morphological entities in question via brushstrokes directly on the image – for example from interstitium, glands, tumor, colon crypts to tubules – and the background. The classifier only needs a representative number of these brushstrokes to discriminate between one tissue class and another. This enables the tissue classifier to generate binary masks for each detected morphological tissue entity. It does so autonomously, and with high degrees of accuracy. These classifier masks can be run through further analysis to gather even richer insights into tissue class-specific properties, from cell count to size. The benefits of compliant machine learning tissue classifiers are self-evident when it comes to histopathology. Diagnosticians and pathologists can go beyond classical biopsy analysis by examining diseased tissues faster and with a greater depth of insight than ever before. Machine learning algorithms represent one of the best solutions for computer-aided histopathology due to their speed, accuracy, and relative simplicity. Refer to our example on the detection of nuclei within high density immune cell organs using the Deep Neural Network and the classifierfor information on how our machine learning tissue classifiers are used in real-world scenarios. Or, if you have any questions about the specifications and costing of our AI-based classifier, why not contacta member of the team today?
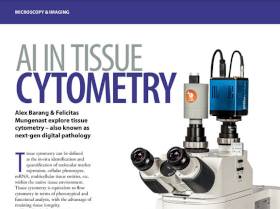
Alex Barang and Felicitas Mungenast (TissueGnostics) wrote an article for euroLab magazine about tissue cytometry in the scope of precision medicine. Futher they focused on how AI can enhance tissue cytometry and how tissue cytometry can enrich your reserach.
09 SEP
09. September 2021
Webinar - Imaging & Quantifying Immune Cell Infiltration in Murine Models of Liver Failure
Dr. Gregory CG Hugenholtz, Deptartment of Surgery, University Medical Center Groningen, talks about "TAFI deficiency promotes liver damage in murine models of liver failure through defective down-regulation of hepatic inflammation". TissueGnostics brightfield single cell analysis software HistoQuest was used to analyse neutrophil infiltration in situ.
15 SEP
15. September 2021
Editorial - Automation in Multiplexing
Alex Barang, responsible for International Sales & Business Development at TissueGnostics, contributed recently to an Biocompare editorial about 'Automation in Multiplexing'.
04 OCT
04. October 2021
White Paper Enhancing CAR-T Cell Therapy for Glioblastoma
Surgery, chemotherapy and radiation have formed the mainstay of cancer therapy for many years. However, in addition to destroying tumor cells, these treatments are detrimental to healthy cells giving rise to side effects, which can be severe. During the last two decades, more targeted therapies that specifically destroy cancer cells have been developed to minimize unwanted side effects.
The IHC Immune Status in Situ App uses the AI classifier to segment tissue into morphological entities such as tumor, stroma, and lymphocyte clusters. It further identifies single cells ...
Publications
TOOLS
Reference Publications
Explore our online database of reference publications to find tout how tissue cytometry can elevate your research
Appcenter
TOOLS
StrataQuest Appcenter
Explore our vast catalog of analysis solutions in our Strataquest Appcenter and get inspired by the variety of applications.
Nadine Bayer
TG ACADEMY WEBINAR
The Effect of Stem Cell Transplantation on Skin Microorganisms
Read about tissue cytometry's potential in understanding the complexities of cell populations in the tissue environment
Contact
TissueGnostics GmbH Taborstraße 10/2/8 1020 Vienna, Austria +43 1 216 11 90 This email address is being protected from spambots. You need JavaScript enabled to view it.
We use cookies on our website. Some of them are essential for the operation of the site, while others help us to improve this site and the user experience (tracking cookies). You can decide for yourself whether you want to allow cookies or not. Please note that if you reject them, you may not be able to use all the functionalities of the site.
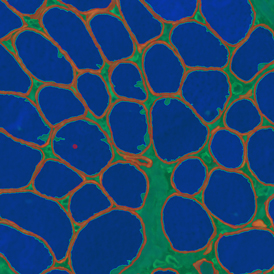
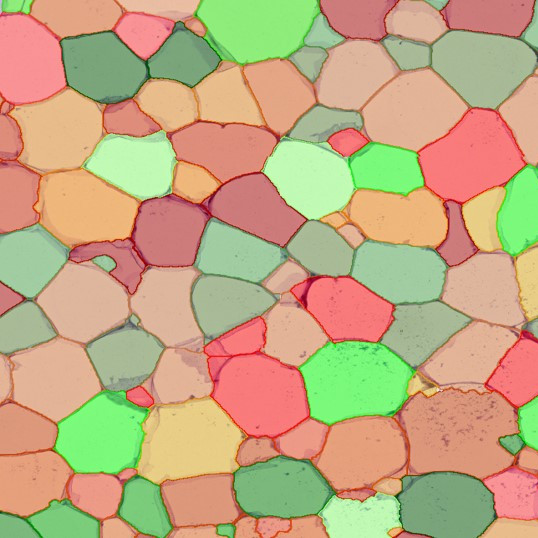
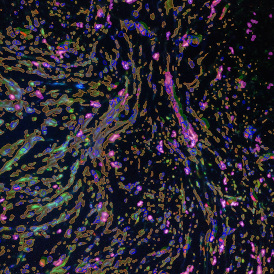
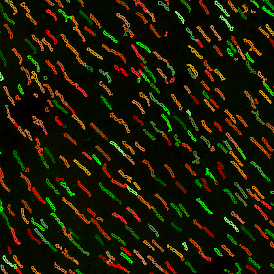
The IF Skeletal Muscle App allows the segmentation of skeletal muscle tissue sections into muscle fibers and connective tissue based on specific IF staining. Outcome parameters are provided, such as the number of muscle fibers and area of the total tissue, muscle fibers, and connective tissue.
Image: Courtesy of Stefania Petrini, Bambino Gesù Children’s Hospital, Rome
App Category 2
IHC ADIPOCYTE
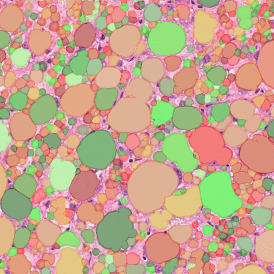
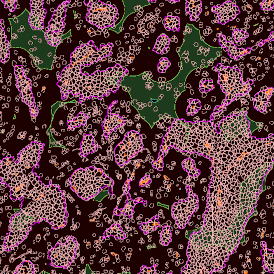
The IHC Adipocyte App quantifies adipocytes and their lumen in adequate HE samples. The App automatically mends small rips in adipocyte membranes and eliminates cell membrane artifacts in adipocyte lumina and lumina on sample borders. The App also outputs area measurements for all detected adipocyte lumina.
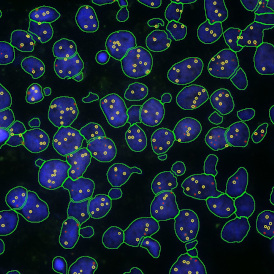
The IF 2 App provides single cell-based co-expression analysis for two IF markers. It segments cells into their nucleus, perinuclear area, and/or cytoplasm. Each segmented cell compartment is measured for up to 20 intensity, statistic, and morphometric parameters that can be displayed in and exported into scattergrams and histograms.
App Category 1
IF 3
The IF 3 App provides single cell-based co-expression analysis for three IF markers. It segments cells into their nucleus, perinuclear area, and/or cytoplasm. Each segmented cell compartment is measured for up to 20 intensity, statistic, and morphometric parameters that can be displayed in and exported into scattergrams and histograms.
App Category 1
IF 4
The IF 4 App provides single cell-based co-expression analysis for four IF markers. It segments cells into their nucleus, perinuclear area, and/or cytoplasm. Each segmented cell compartment is measured for up to 20 intensity, statistic, and morphometric parameters that can be displayed in and exported into scattergrams and histograms.
App Category 2
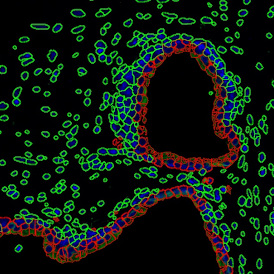
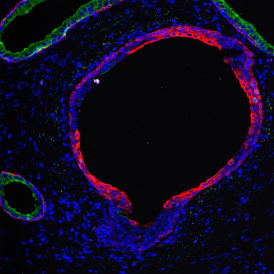
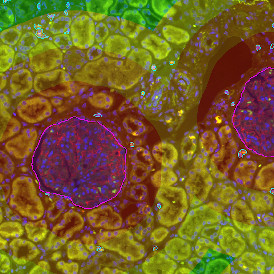
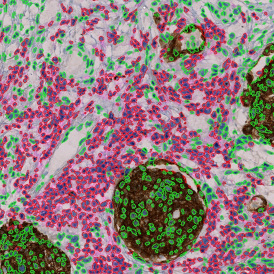
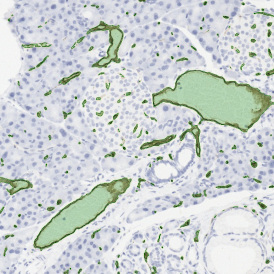
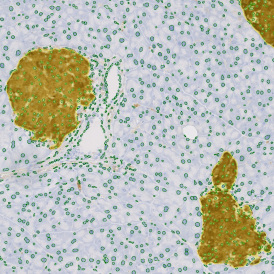
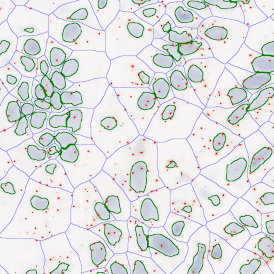
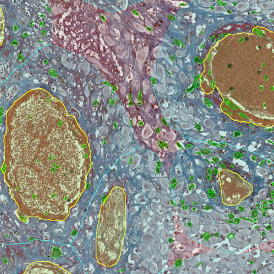
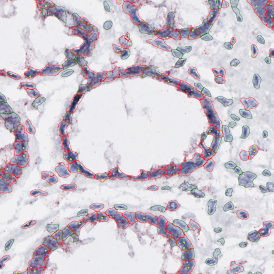
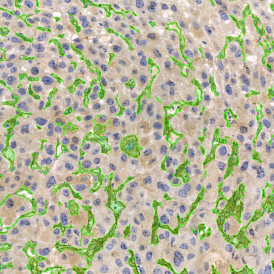
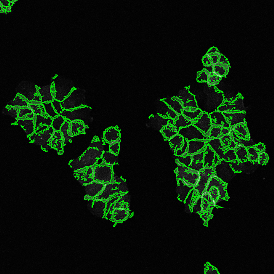
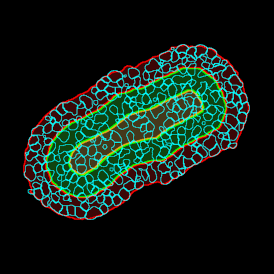
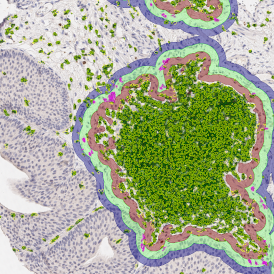
IF GLOMERULI
The IF Glomeruli App provides the detection of tissue, cells, and glomeruli stained by a specific marker. It segments the cells into their nucleus and/or cytoplasm and determines the cellular phenotype of specific IF-stained cell populations. The detected cells can be classified as being either inside or outside the glomeruli within certain distances (distance ranges are definable). For each cell, the spatial information and up to 20 intensity, statistics, and morphometric parameters are measured. The data can be displayed in diagrams and exported.
App Category 3
IF HI-PLEX 50
The IF Hi-Plex 50 App combines and analyses images of the same IF-stained tissue section, acquired up to 50 times with different markers. The App enables the detection of the cellular phenotypes of specific IF-stained cell populations. It segments cells into their nucleus, perinuclear area, and/or cytoplasm. Each segmented cell compartment is measured for up to 20 intensity, statistic, and morphometric parameters that can be displayed in and exported into scattergrams and histograms.
App Category 3
IF DOTS
The IF Dots App provides dot detection per cell within the cell compartments for up to four markers in a sample (e.g., FISH, RNA, oil droplets). Each segmented cell compartment is measured for up to 20 intensity, statistic, and morphometric parameters. Dot measurement parameters are provided per cell compartment (e.g., nucleus, cytoplasm) and per dot and include count, mean intensity, total dot area, the sum of intensity.
The IF Immune Status in Situ App provides a phenotypic characterization of immune cells in reference to detected metastructures (e.g., tumors, glands) and measures the distance of detected cellular objects to the metastructure boundary (within and/or outside). Distance ranges are also definable. Each segmented cell compartment is measured for up to 20 intensity, statistic, and morphometric parameters, as well as the distance of each cell to the areas boundary.
App Category 3
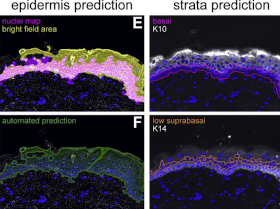
IF SKIN MORPHOLOGY
The IF Skin Morphology App provides tissue detection, including the segmentation of epidermis and dermis, based on specific IF staining. It segments cells into their nucleus, perinuclear area, and/or cytoplasm and determines the cellular phenotype of specific IF-stained cell populations. The detected cells can be classified and visualized as being within or outside detected structures (epidermis and dermis). Each segmented cell compartment is measured for up to 20 intensity, statistic, and morphometric parameters that can then be displayed in diagrams and exported.
App Category 3
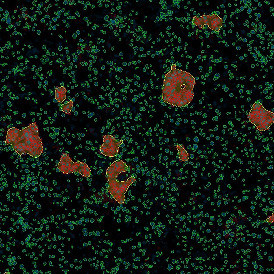
IF GRANULOMA
The IF Granuloma App detects granulomas based on nuclear structure analysis and an adequate IF staining (e.g., CD11c, CD68). The App measures the number and area of Granulomas and their density. Each segmented cell compartment is measured for up to 20 intensity, statistic, and morphometric parameters.
App Category 2
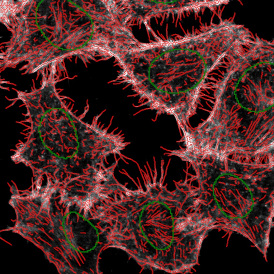
IF CYTOSKELETON
The IF Cytoskeleton App detects cytoskeletal structures based on a specific stain. The cell cytoplasm can be detected using other stains. Data can also be exported, including the number of cytoskeletal filaments inside and outside the cell and on the cell membrane, filament length, and total filament area.
App Category 3
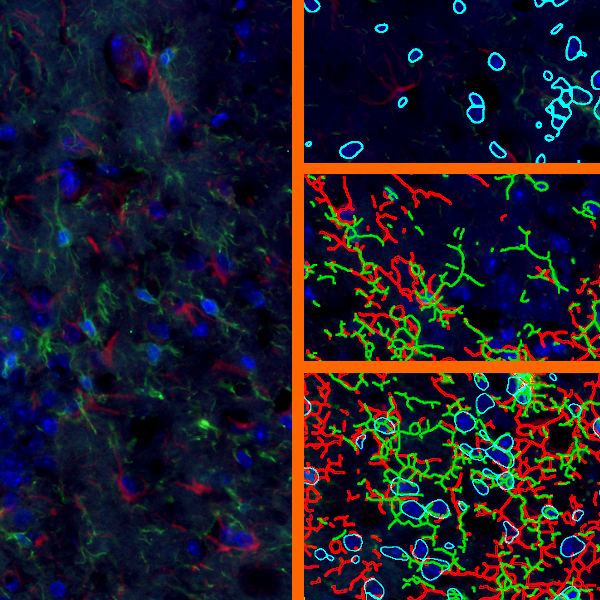
IF GLIAL CELLS
The IF Glial Cells App allows the detection of astrocytes and microglia based on specific IF staining. The measurements assessed by the App include the number of astrocytes and microglia and the number of branches of each cell (short and long attached).
App Category 3
IHC 2
The IHC 2 App unmixes two markers (e.g., chromogen and counterstain) in an IHC or HC digital slide and segments single cells into their nucleus, perinuclear area, and/or cytoplasm. Each segmented cell compartment is measured for up to 20 intensity, statistic, and morphometric parameters that can be displayed in and exported into scattergrams and histograms.
The IHC 3 App unmixes three markers (e.g., two chromogens and a counterstain) in an IHC or HC digital slide and segments single cells into their nucleus, perinuclear area, and/or cytoplasm. Each segmented cell compartment is measured for up to 20 intensity, statistic, and morphometric parameters that can be displayed in and exported into scattergrams and histograms.
App Category 2
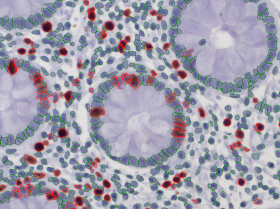
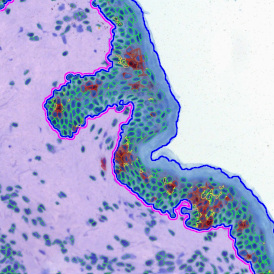
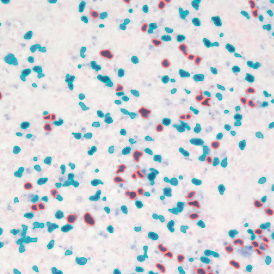
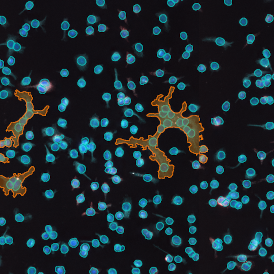
IHC MACROPHAGES
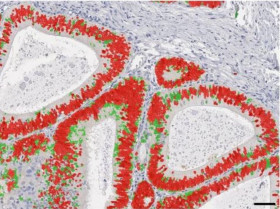
The IHC Macrophages App detects macrophages based on adequately stained IHC samples. The App can be combined with area detection and distance range algorithms to determine the distance of Langerhans cells from the border of the epidermis inside and outside the epidermis (see above example). Each segmented cell compartment is measured for up to 20 parameters, as is the distance of each cell to the boundary.
App Category 3
IHC TUMOR-STROMA
The IHC Tumor-Stroma App combines the segmentation of tumor and stroma (based on the morphology) and the detection of specifically stained cell populations. It segments the cells into their nucleus, perinuclear area, and/or cytoplasm. Each segmented cell compartment in tumor and/or stroma is measured for up to 20 intensity, statistic, and morphometric parameters that can be displayed in and exported into scattergrams and histograms.
App Category 2
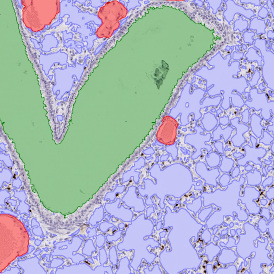
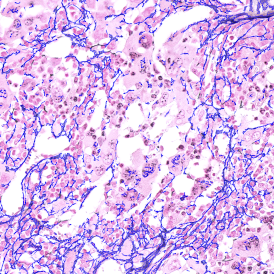
PULMO
The Pulmo App segments nuclei and the metastructure components of the lung, including tissue, bronchioles, blood vessels, and alveoles. Each segmented metastructure is measured for up to 20 morphometric parameters.
App Category 3
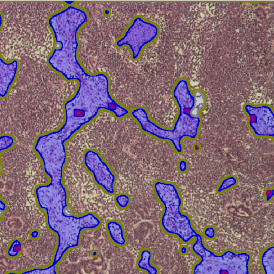
IHC ANGIO
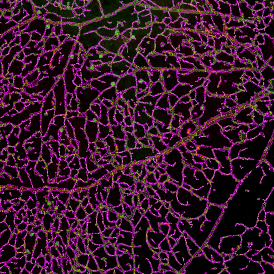
The IHC Angio App detects blood vessels based on appropriate stains (e.g., CD31) and measures overall vessel and lumen areas. The vessel detection can be set to close open stained vessel walls and connect separated vessel sections within a definable distance. As well as vessel number, density, and areas, the App also outputs endothelium and lumina areas.
App Category 2
IHC META CELLS
The IHC Meta Cells App combines the detection of IHC/HC stained metastructures (e.g., Langerhans islets, Tumor - Stroma) with single-cell detection (segmentation of cells into nucleus, perinuclear area, and/or cytoplasm). Detected cells can be classified and visualized as being within or outside detected metastructures. Each detected area and cell compartment is measured for up to 20 intensity, statistic, and morphometric parameters.
App Category 2
RNA SCOPE
The RNA Scope App enables the detection of nuclei based on appropriate staining and dot detection per cell within nucleus and/or cytoplasm for one dot marker in CISH and SISH experiments . Each segmented cell compartment is measured for up to 20 intensity, statistic, and morphometric parameters. Dot parameters are provided per cell and per dot and include count, mean intensity, total dot area and the sum of intensity.
App Category 2
TUMOR FOCI
The Tumor Foci App allows for the detection of the whole tissue and, more importantly, tumor foci based on nuclear structure analysis, mainly on HE staining. The number, area, and density of tumor foci are measured.
App Category 1
IHC MEMBRANE
The IHC Membrane App unmixes up to three markers in an IHC or HC digital slide and segments cells into nucleus, perinuclear area, and/or cytoplasm, as well as into membrane (e.g., HER2/neu). Each segmented cell compartment is measured for up to 20 intensity, statistic, and morphometric parameters. Three more parameters are measured for membrane intensity and angle of staining. All parameters are displayed in scattergrams and histograms and can be exported.
App Category 2
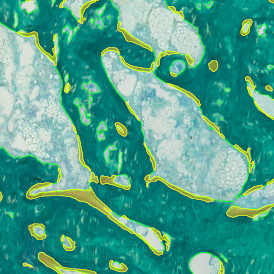
BONE GOLDNER
The Bone Tissue Analysis Goldner App allows for the detection of mineralized bone tissue and osteoid based on Goldner-stained bone tissue sections. The App assesses parameters such as BV (bone volume), TV (trabecular bone volume), OV (osteoid volume), OV/BV, OV/TV, OS (osteoid surface), BS (bone surface length), and the mean of osteoid width and thickness.
App Category 2
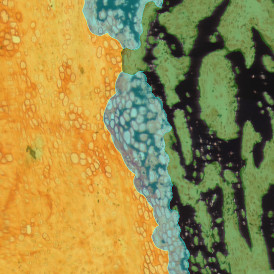
BONE MINERALIZATION
The Bone Mineralization APP separates Safranin O-stained bone tissue into its morphological substructures (cartilage, mineralized cartilage, bone marrow, and mineralized bone). Measurements assessed with this App include TV (trabecular bone volume), BV (total bone volume), MCV (mineralized cartilage), CV (cartilage volume), and bone marrow (BM).
App Category 3
BONE VON KOSSA
The Bone Tissue Analysis Von Kossa App allows for the detection of mineralized bone tissue based on Von Kossa stained bone tissue sections. The App provides parameters such as TV (trabecular bone volume), BV (bone volume), BS (bone surface), BV/TV, BS/BV, Tb.N (trabecular number), tb.Th (trabecular thickness), and Tb.Sp (trabecular separation).
App Category 2
IF LEISHMANIASIS
The IF Leishmaniasis App detects intracellular Leishmania parasites and segments them in the detected host cells. The number of parasites per cell is determined, and living and dead parasites can be distinguished (live/dead assays). The App outputs 20 intensity, statistic, and morphometric parameters for each segmented cell compartment per marker, as well as the number, mean intensity, sum of intensity, and size of parasites.
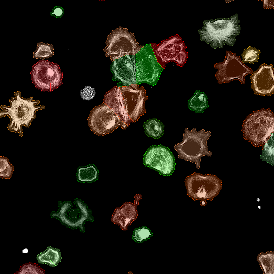
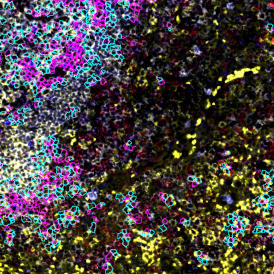
The IF Cellular Microenvironment App allows to determine the cellular phenotype of specific IF-stained cell populations and establishes their spatial relationship between each other and their neighboring cells/cell populations, including those with metastructures (e.g., blood vessels, tumors) in their vicinity. It is especially suited for proximity and infiltration analyses.
App Category 4
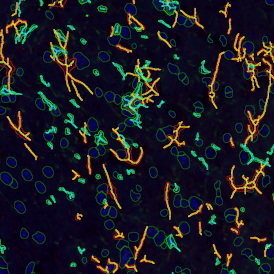
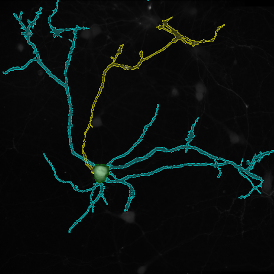
IF NEURITE
The IF Neurite App identifies neuronal cells and cell clusters and their neurites/dendrites. It quantifies the number of neurites/dendrites branching out from a specific neuron, identifies branch points, and exports total neurite/dendrite area, total neurite/dendrite length, average neurite/dendrite thickness, the number of branch points, and the number of endpoints.
App Category 3
IF PYKNOTIC NUCLEI
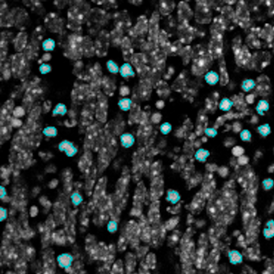
The IF Pyknotic Nuclei App provides tissue detection and cell segmentation in combination with the detection of pyknotic nuclei (defined as completely condensed, round, high-intensity nuclei) based on nuclei staining. Additionally, the App allows for the determination of the cellular phenotype of specific IF-stained cell populations and dot detection. It segments the detected cells into nucleus, perinuclear area, and/or cytoplasm. The App provides parameters such as the number, mean intensity, and percentage of specific cell populations (including cells containing pyknotic nuclei). It also outputs dot parameters per segmented cell and/or dot, including count, mean intensity, total dot area, and sum of intensity.
App Category 3
IF TUMOR VASCULARIZATION
The IF Tumor Vascularization App provides tissue detection, including the separation of tumor tissue and tumor stroma (healthy tissue). Additionally, it detects blood vessels based on appropriate stains (e.g., CD31) and measures the number, area, and density of these blood vessels. The vessel detection also can be set to close open stained vessel walls and to connect separated vessel sections within a definable distance.
App Category 3
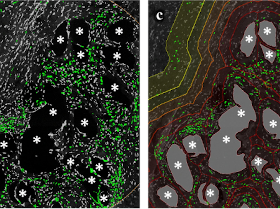
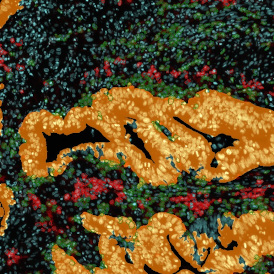
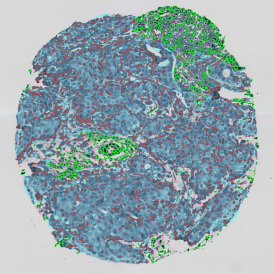
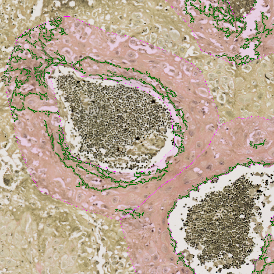
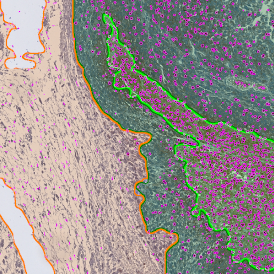
IHC TUMOR MACROPHAGES
The IHC Tumor-Macrophages App provides tissue detection, including the separation of tumor and healthy tissue. It detects macrophages based on specific staining (e.g., CD68) and outputs the area of macrophages within tumor and healthy tissue.
Image: Courtesy of Dr. Patrick Michl, Dr. Maren Egidi, and Dr. Heidi Griesmann, Universitätsklinikum Halle (Saale).
App Category 3
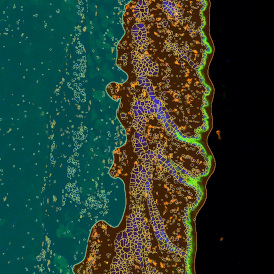
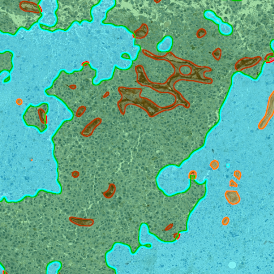
IHC TUMOR VASCULARIZATION
The IHC Tumor Vascularization App provides tissue detection, including the separation of tumor tissue and tumor stroma (healthy tissue). Additionally, it detects blood vessels based on appropriate stains (e.g., CD31) and measures the number and area of these blood vessels. The vessel detection can also be programmed to close open stained vessel walls and to connect separated vessel sections within a definable distance. The App outputs the number, density, and areas of vessels within both tumor and healthy tissue.
Image: Courtesy of Dr. Patrick Michl, Dr. Maren Egidi, and Dr. Heidi Griesmann, Universitätsklinikum Halle (Saale).
App Category 3
IHC ANGIO TRICHOME
The IHC Angio Trichome App detects blood vessels based on trichome staining and measures the overall vessel and lumen area. Furthermore, it detects specifically IHC-stained single cell populations and establishes their spatial relationship to the detected blood vessels. The App outputs number and vessel density, vessel wall thickness and areas of vessels, endothelium and lumina, the number of IHC stained cells, proximity measurement, etc.
App Category 3
RNA SCOPE+
The RNA Scope+ App provides detection of nuclei based on appropriate staining and dot detection per cell within the nucleus and/or cytoplasm for two dot markers in CISH and SISH experiments. Each segmented cell compartment is measured for up to 20 intensity, statistic, and morphometric parameters. It also outputs dot parameters per segmented cell and/or dot, including count, mean intensity, total dot area, and sum of intensity.
App Category 2
IHC ANGIO ELASTIN
The IHC Angio Elastin App detects blood vessels in Verhoeffs van Geison-stained samples, elastin, and collagen. The outputs include the number and area of vessels, elastin, and collagen within a definable distance to the vessel.
App Category 2
Contact us
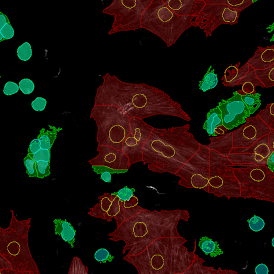
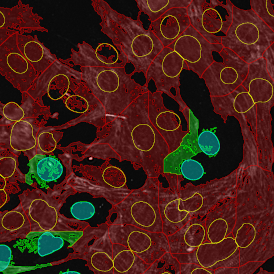
IF CARDIO CELL CULTURE
The IF Cardio Cell Culture App provides cell segmentation, detection of cardiomyocytes (based on appropriate staining, e.g., Troponin Red), fibroblasts within cultured cardio cells, plus one additional marker. The App outputs parameters such as the number of cardiomyocytes, fibroblasts, and marker-positive cardiomyocytes and fibroblasts.
Image: Courtesy of Agatha Ribeiro da Silva, Prof. Jose E. Krieger (Heart Institute, University Sao Paulo)
App Category 3
IF CARDIO CELL CULTURE DOTS
The IF Cardio Cell Culture Dot App provides cell segmentation and detection of cardiomyocytes (based on an appropriate stain, e.g., Troponin Red) and fibroblasts within cultured cardio cells, plus one dot marker (CISH, FISH). The App outputs parameters such as the number of cardiomyocytes and fibroblasts. It also outputs the number of dot-positive cardiomyocytes and fibroblasts and the number, area (μm²), and mean intensity of dots per cell.
Image: Courtesy of Agatha Ribeiro da Silva, Prof. Jose E. Krieger (Heart Institute, University Sao Paulo).
App Category 3
IF DENDRITES AND AXONS
The IF Dendrites & Axons App identifies neuronal cells, their dendrites and axon, based on appropriate markers. It quantifies the number of dendrites branching out from a specific neuron. The App provides the total number of dendrites per neuron, including the length of these dendrites and their axons.
Image: Courtesy of Thomas Bastian, Ph.D., University of Minnesota.
App Category 3
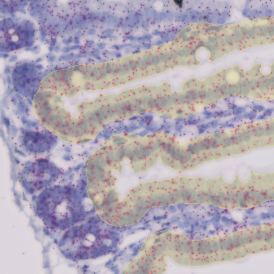
IHC SMALL INTESTINE - DOTS
The IHC Small Intestine - Dots App provides nuclei segmentation and detection of tissue and villi based on nuclei staining (crypts need to be defined manually). Furthermore, it allows dot detection for one dot markers (CISH, RNAScope, SISH) within villi and crypt areas. Dot parameters are provided for villi and crypts and for dots and include count, mean intensity, total dot area, the sum of intensity.
App Category 2
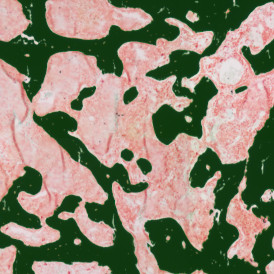
LIPID DROPLETS
The Lipid Droplets App quantifies lipid droplets within H&E stained tissues (e.g., liver). The App automatically mends small rips in liver droplet membranes and eliminates cell membrane artifacts, including lumina on sample borders. The App also outputs area and number measurements for all detected lipid droplets.
App Category 1
ANGIO SIRIUS RED
The Angio Sirius Red App detects collagen and blood vessels based on Sirius Red staining. The app outputs the area of Sirius Red stained collagen and the number of detected vessels.
App Category 2
IHC ANGIO DIAMETER
The IHC Angio Diameter App detects blood vessels based on appropriate stains (e.g., CD31). The App outputs vessel area, number, density, and blood vessel diameter.
App Category 2
IF CULTURED CELLS & SUBSTRUCTURES
The IF Cultured Cells & Substructures App detects cells based on nuclei staining, as well as one dot marker (FISH, CISH experiments) and cytoskeletal structures based on a specific stain. It outputs the number of detected cells, the number and intensity of dots per cell, and the density of cytoskeletal filaments.
App Category 3
IF MEMBRANE
The IF Membrane App detects nuclei and segments the cells into different cellular compartments, including membrane, nuclei, and cytoplasm. It also detects one additional marker (e.g., HER2/neu). Each segmented cell compartment is measured for different parameters, such as staining intensity, stained area, and the number/percentage of marker-positive cells within the detected cellular compartments. Three more parameters are measured for the membrane, including membrane area, membrane length, and the angle of staining.
App Category 2
IF SPHEROIDS
The IF Spheroids App allows a comprehensive analysis of spheroids (as well as organoids and embryoid bodies). It automatically identifies the spheroids and cells based on the nuclei staining and analyzes two additional IF markers. It segments the cells into different cellular compartments, including membrane, nuclei, and cytosol, and further measures the marker expression for each compartment. It can also measure dot markers (if available). It establishes proximity distances for the cells detected within the spheroids, bringing the IF-stained cell populations into spatial context.
App Category 3
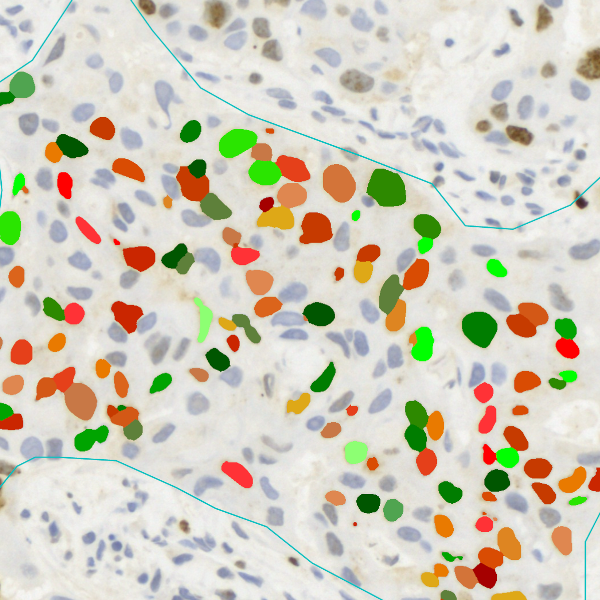
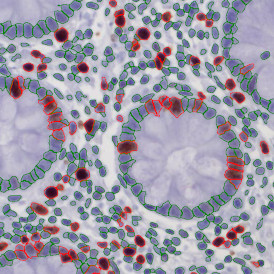
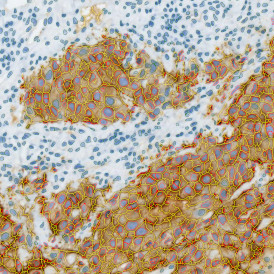
IHC IMMUNE STATUS IN SITU
The IHC Immune Status in Situ App uses the AI classifier to segment tissue into morphological entities such as tumor, stroma, and lymphocyte clusters. It further identifies single cells based on nuclei staining (hematoxylin), detects immune cells based on appropriated stains (CD45, CD3, CD20, etc.), and measures the distance of detected cells to the metastructure boundary. The App can also define distance ranges through outputting parameters, including the area of the detected morphological entities and the number/percentage of lymphocytes detected within the tissue entities, as well as in certain proximities.
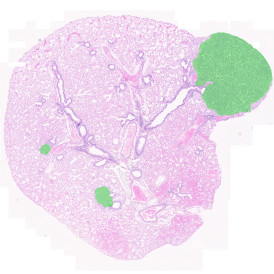
The Wilms Tumor App is based on the AI Classifier and allows for the segmentation of H&E stained Wilms tumor tissues into tumor, stroma, and blood vessels. It outputs the area (µm2) of the segmented tissue entities.
App Category 1
IHC NECROTIC TUMOR
The IHC Necrotic Tumor App segments tumor tissues into tumor, necrotic tissue, and stroma using the AI Classifier. Furthermore, it identifies single cells as well as one additional cellular marker (e.g., neutrophils). It outputs the area of tumor, necrotic tissue, and stroma and measures the number and percentage of neutrophils within the morphological entities.
App Category 3
IHC NECROTIC TUMOR ANGIO
The IHC Necrotic Tumor Angio App can segment tumor tissues into tumor, necrotic tissue, and blood vessels using the AI Classifier. It outputs the area of tumor, necrotic tissue, and blood vessels, as well as the number and percentage of blood vessels in total and within the two morphological entities.
App Category 3
IF RODS AND CONES IN RETINA
The IF Rods & Cones in Retina App detects the rods and cones based on specific staining. It outputs the number, density, and length of detected structures, as well as the number, percentage, and density of marker-stained rods and cones.
App Category 2
IF TUMOR FOCI ANGIO
The IF Tumor Foci Angio App identifies single cells and segments tissues into tumor foci and blood vessels based on appropriate markers. It applies proximity maps to identify nuclei close to blood vessels. It measures the number of nuclei located within a certain distance relative to blood vessels, the number of nuclei in the different morphological entities, and the area of these morphological entities.
The IF Retinal Vasculature App detects blood vessels in retinal tissue based on appropriate stains (e.g., CD31). The App outputs vessel area, density, and length.
App Category 2
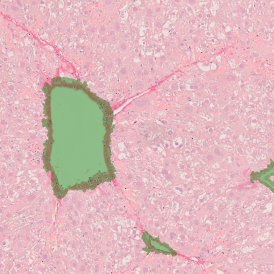
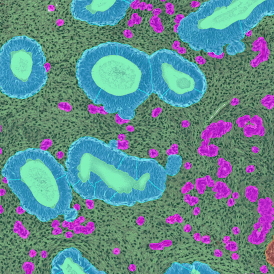
ENDOMETRIUM HE
The Endometrium HE App allows for the segmentation of hematoxylin and eosin-stained endometrium tissues into their morphological entities (glands, stroma, and blood vessels). The measurements provided by the App include the area of glands, stroma, and blood vessels.
App Category 2
IHC EXTRACELLULAR FILAMENTS
The IHC Extracellular Filament App detects nuclei and extracellular filaments stained with specific markers. It outputs the number of nuclei, total filaments area, and the length of these filaments.
App Category 2
IF CELLULAR CONTACT
The IF Cellular Contact App allows for the determination of the cellular phenotype of specific IF-stained cell populations and establishes the cellular contacts to their neighboring cells (the number of markers is technically unlimited). If needed, the App provides a separation of nuclei in tissues with high cellular densities. The App outputs parameters such as staining intensity per marker and morphometric parameters for each segmented cell/cell compartment, as well as the number and percentage of cells of different phenotypes in direct contact.
Images: courtesy of Naoki Kaneko/Shiv Pillai (PI), Ragon Institute of MGH, MIT and Harvard, Boston, MA USA.
The EBER-ISH App analyzes tissue samples stained by EBER-ISH probes (EBV-encoded RNA in-situ hybridization). These probes visualize the Epstein-Barr virus (EBV) EBER RNA. First, the App identifies nuclei, then detects EBER-ISH positive nuclei. The measurements provided by the App include the number of detected cells and the number, density, and percentage of EBER-ISH positive cells.
App Category 1
IF CELL CULTURE - OSTEOCLAST
The IF Cell Culture - Osteoclast App allows for the segmentation of nuclei, the identification of cultured multinucleated osteoclasts (stained by a specific marker), and the quantification of one or two additional markers. Outputs include the number of detected cells, osteoclasts, and nuclei per osteoclast, the area of osteoclasts, and the intensity of markers within the osteoclasts.