Full 1
Tissuequest
multichannel TISSUE CYTOMETRY
Full 1

TissueQuest 
Analysis of fluorescent markers

TissueQuest provides three analysis modes:

  • Cell-based (nucleus, cytoplasm, membrane)
  • Stained areas
  • Small dots (e.g. FISH)

Context-based analysis can be done by manually drawing regions of interest. TMA can be detected and analysed on imported files.

TissueQuest - Features

  • Fluorescence image analysis
  • Assessment of co-expressed markers
  • Streamlined workflow
  • Single cell analysis
  • Analyze tissue sections, TMAs, confluent cells, smears
  • Contextual image analysis by manual ROI definition
  • Nuclear segmentation, total area measurements, dot detection
  • Cytoplasmic and membrane measurements
  • 18 measured metrics per marker
  • Pseudo IHC
  • Image and data comparison tools

TissueQuest is also available as a standalone software.

TissueQuest 7.1
THE EASY SOLUTION FOR IMMUNOFLUORESCENCE ANALYSIS

TissueQuest is an image analysis software for the FACS-like analysis of tissue sections, TMA or cultured cells processed with immunofluorescence. TissueQuest can analyse images from epifluorescence as well as those from Q systems.

TissueQuest

New Features in TissueQuest 7.0

The new features of TissueQuest 7.0 & 7.1  include improvements to the analysis workflow, management of multiple diagrams, image visualization, and the user interface. Here are some highlights:

  • 7.1 Nuclear Segmentation using deep learning. It is a particularly useful and simple solution for nuclear segmentation in tissues with extremely high cellular density, weak signal intensity, or high variation in nuclei size and texture.

  • 7.1 New Region Overlay control for an improved navigation through the different channels enabling an improved user experience and faster feedback.

  • 7.1 Comments from TissueFAXS (slides, regions), including a section for patient information and patient number are available in HistoQuest.

  • 7.1 Export results and analysis masks as BigTiff.

  • 7.1 Batch import is now also available for external import sources.

  • 7.0 The new diagrams viewer displays all diagrams associated with a region or sample and allows the user to perform several new tasks, including changing the order of the diagrams via drag and drop, a print preview of the diagrams, set cut-offs, add gates, or show backward connections in the image.

  • 7.0 To further simplify the validation process, it is now possible to open multiple samples or regions simultaneously in separate detail windows as well as their raw data, diagram details and diagrams viewer. A dedicated Detail Manager helps to stay organized.

  • 7.0 comes with new visualization modes including pseudo IHC, providing a pathology view (pseudo coloured images) as well as the HDR-like mode (high dynamic range) and a smoothen image function.

  • 7.0 The 16 bit projects are fully supported.

  • 7.0 The automatic Tissue and TMA Detection function from TissueFAXS and StrataQuest is now also available in TissueQuest.

  • 7.0 Another new feature is the introduction of the Human Protein Atlas Browser within the TissueQuest software. By simply pressing the Human Protein Atlas Button compare your obtained results to publicly available data.


 pseudo-IHC

DetailManager

Leishmaniasis parasite detection in cell culture and tissue: Leishmaniasis APP

Leishmania donovani parasites are the causative agents of zoonotic and anthroponotic visceral leishmaniasis. There is no prophylactic vaccine and available drugs are either expensive and/or show significant toxicity, making the research on leishmania biology essential for a detailed understanding of the dispersal of these obligatory-intracellular parasites and their host phagocytes in the skin [1].

The Leishmaniasis APP within TissueGnostics contextual image analysis software, StrataQuest, was designed to assist in immunology research into Leishmaniasis and can be adapted for research on other intracellular parasites. It can be used both on cell cultures and tissue sections. Its main function is to automatically detect parasite stages in cell compartments and quantify them in context with specific immune markers. In this case study, we will show in detail how simple and straightforward the analysis is.

The aim of this project was to detect how many cells are infected by leishmaniasis and the number of leishmaniasis parasites per cell.

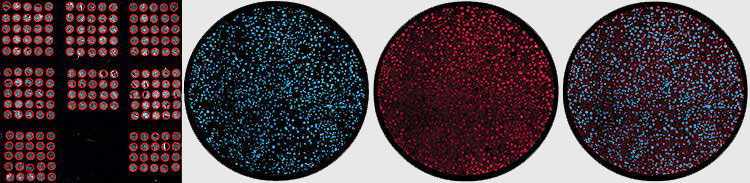
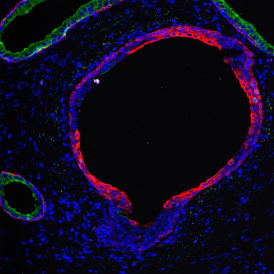
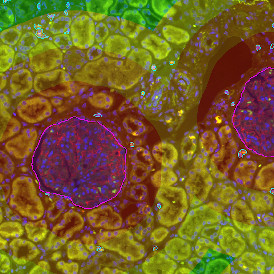
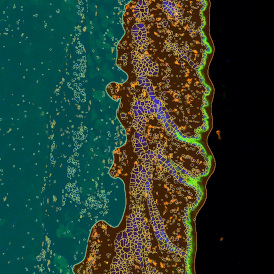
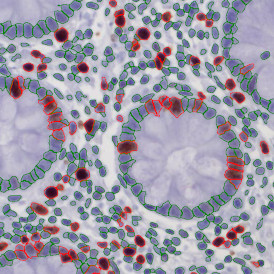
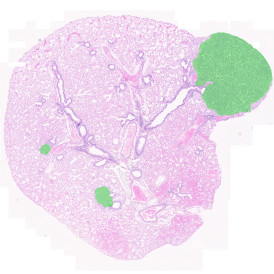
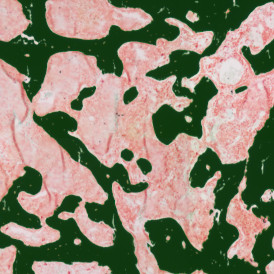
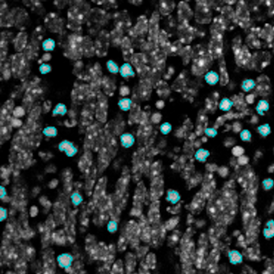
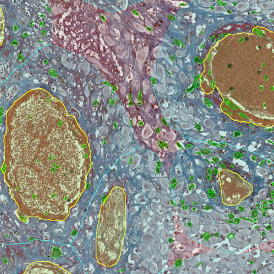
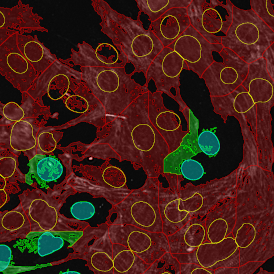
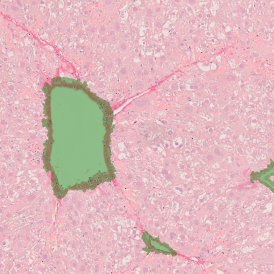
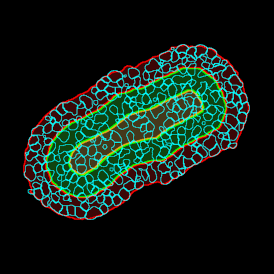
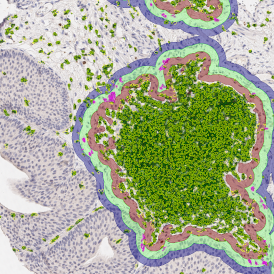
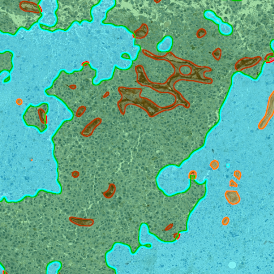
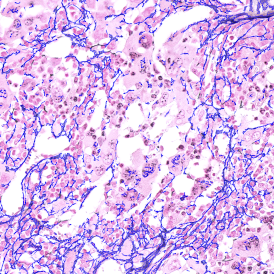
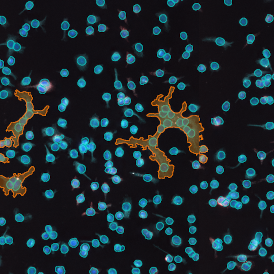
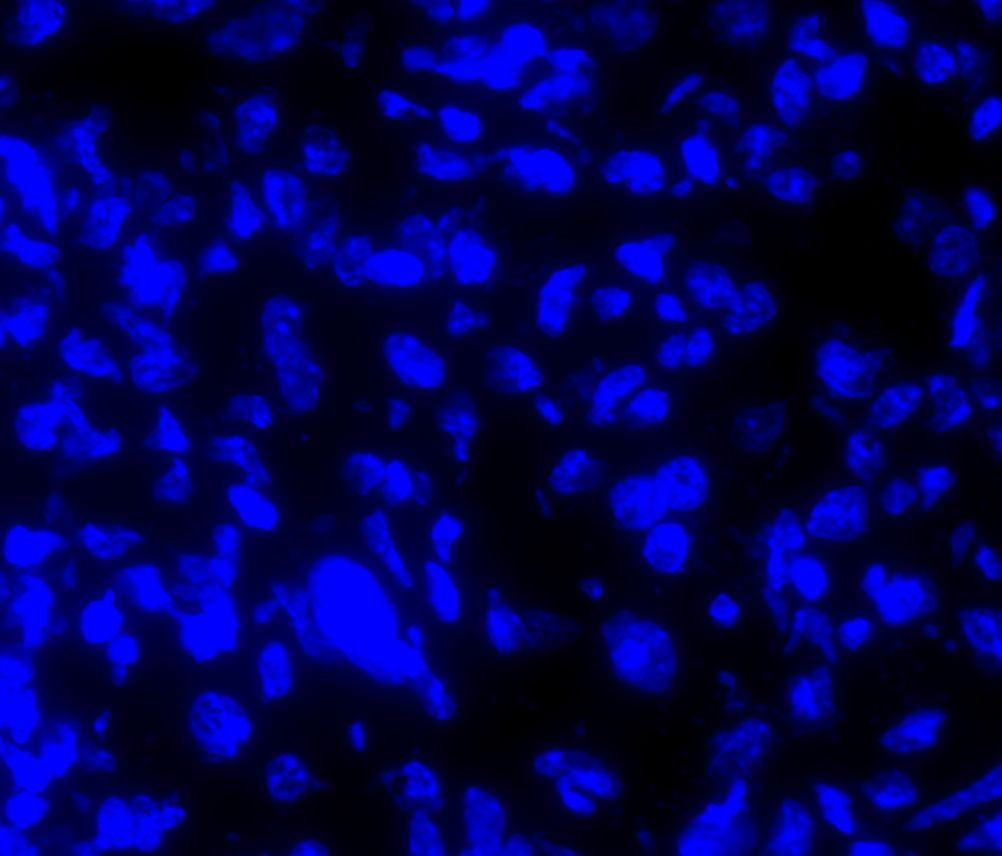
The image below shows a mouse skin-draining lymph node stained with DAPI (nucleus, blue).

 IF_Tumor_Foci_Angio_overview-min.png

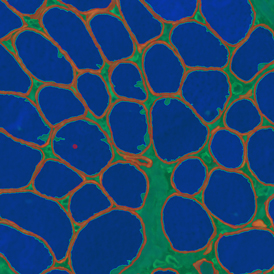
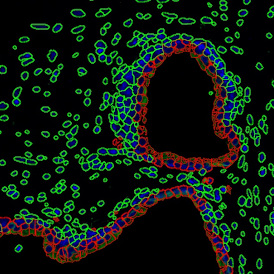
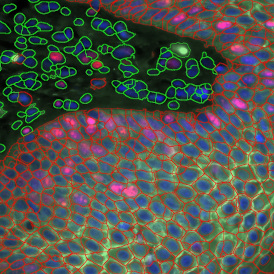
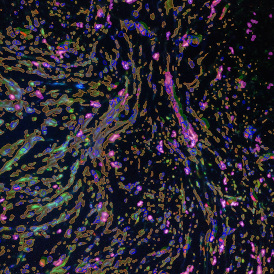
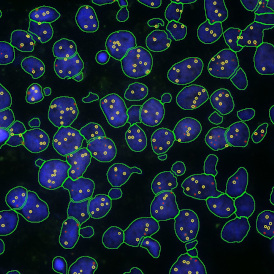
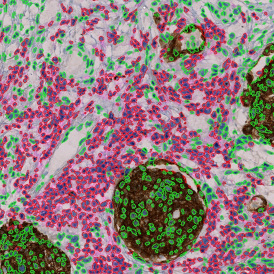
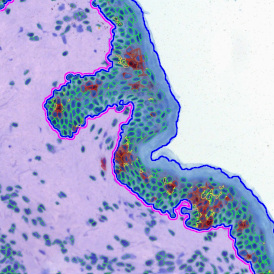
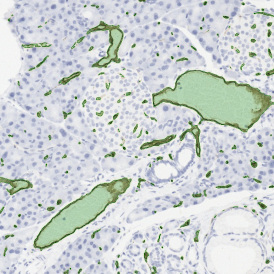
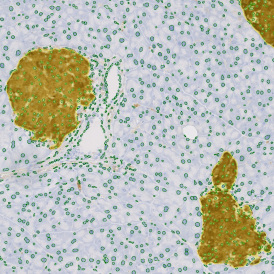
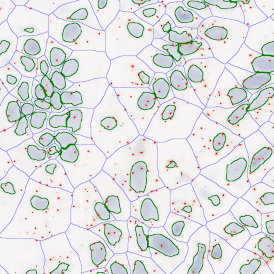
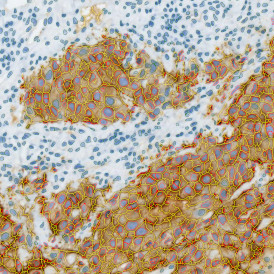
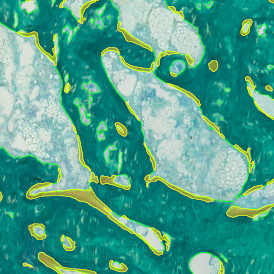
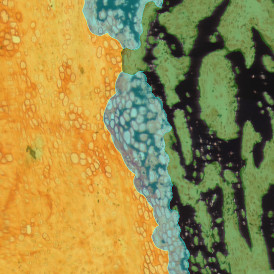
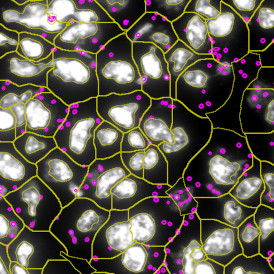
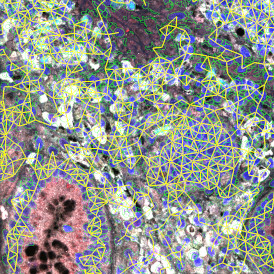
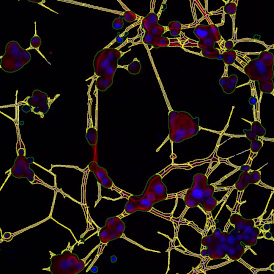
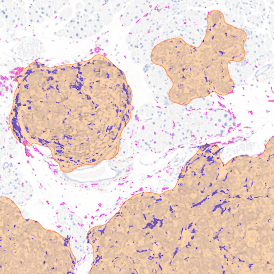
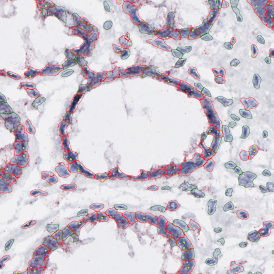
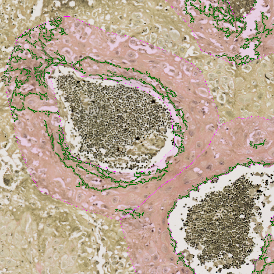
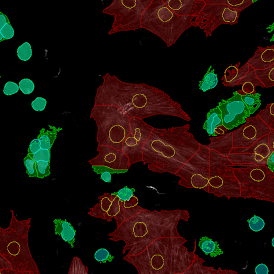
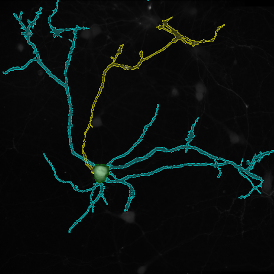
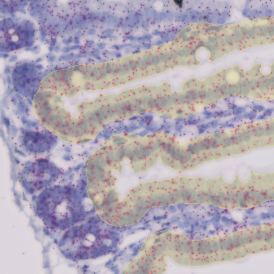
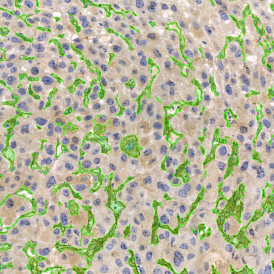
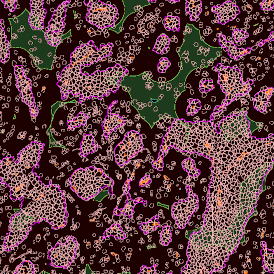
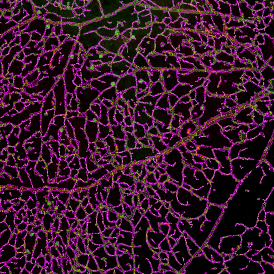
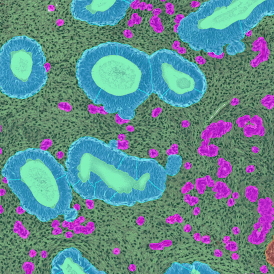
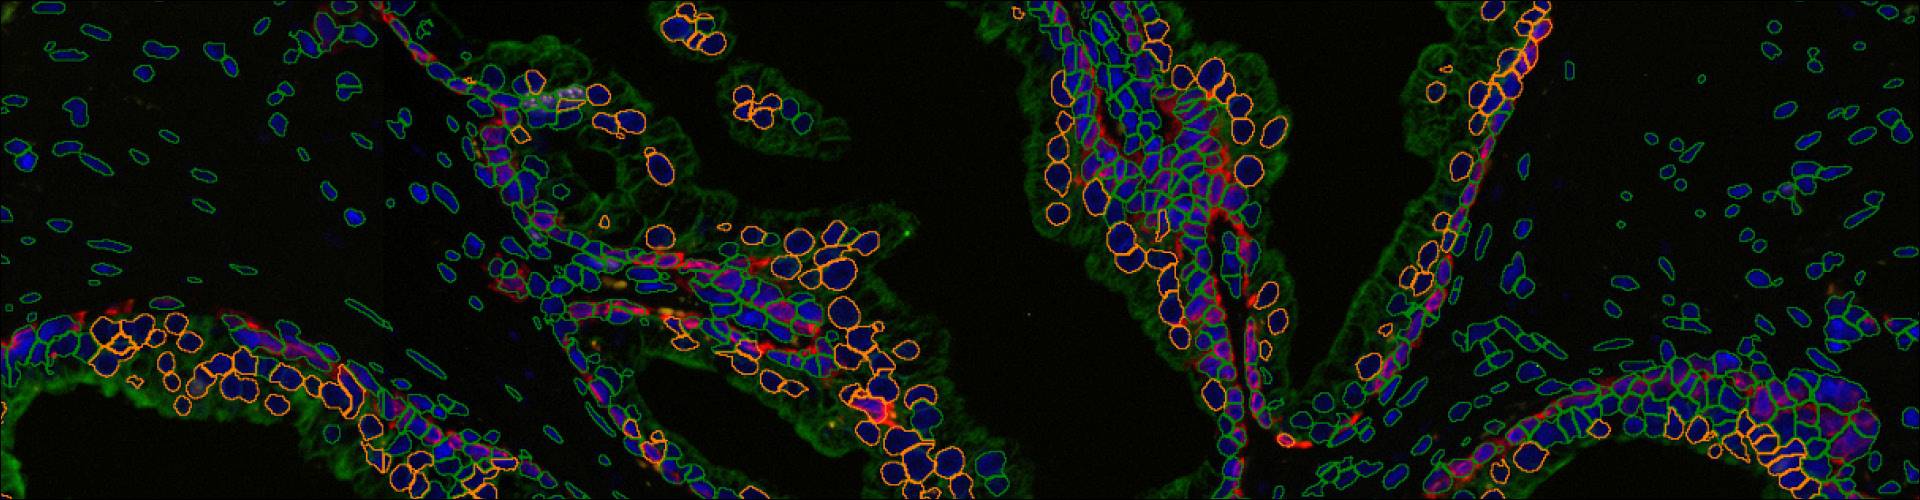
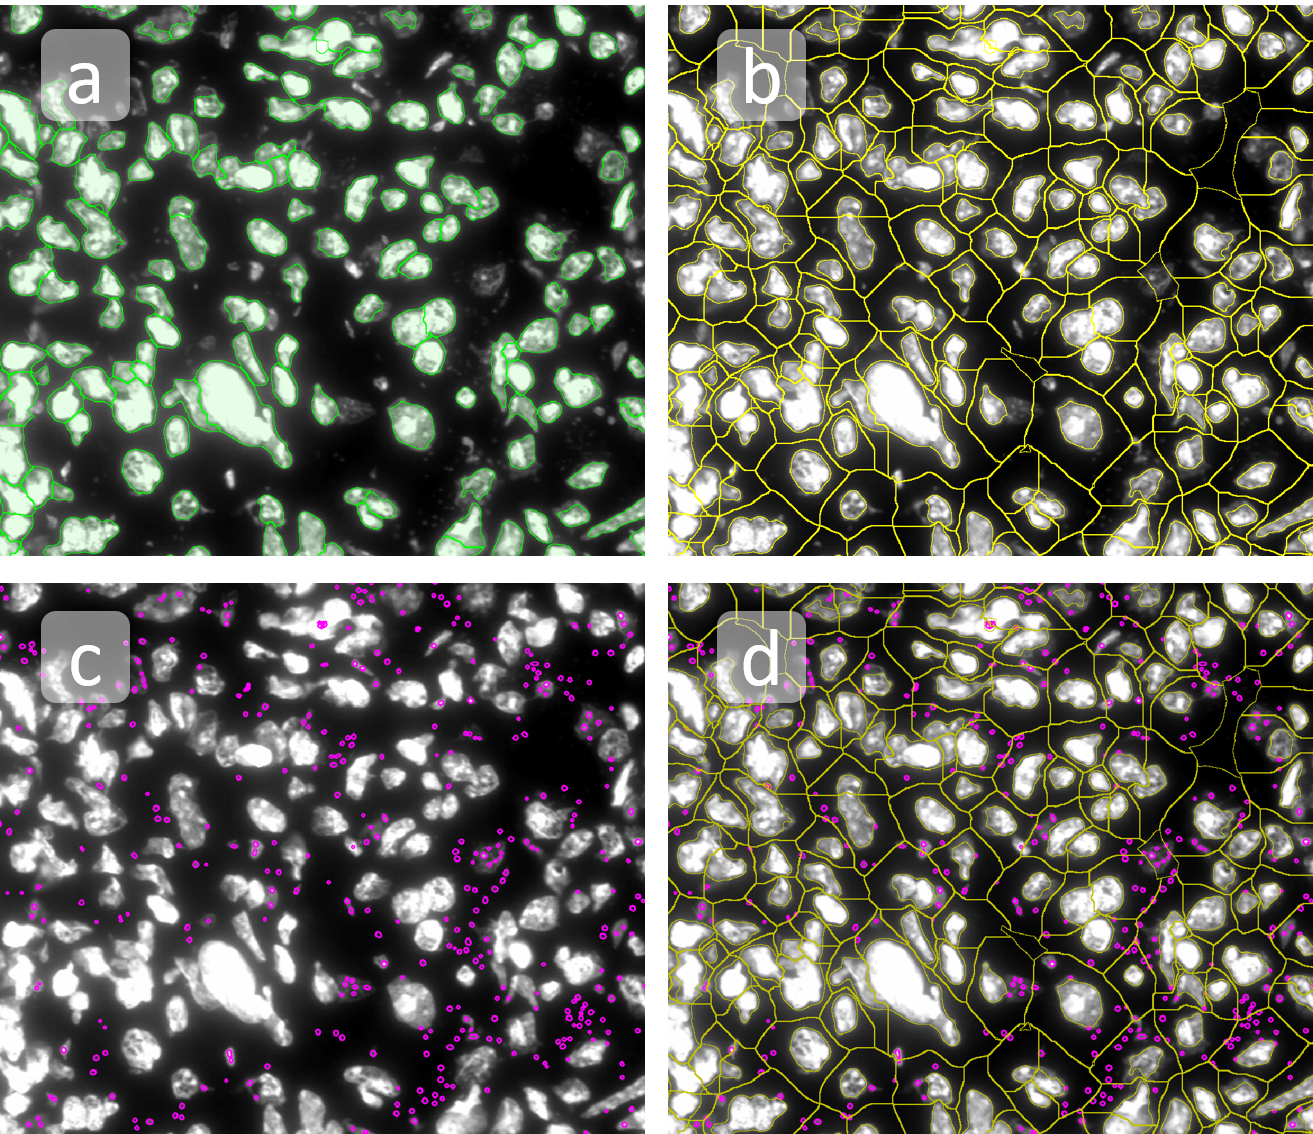
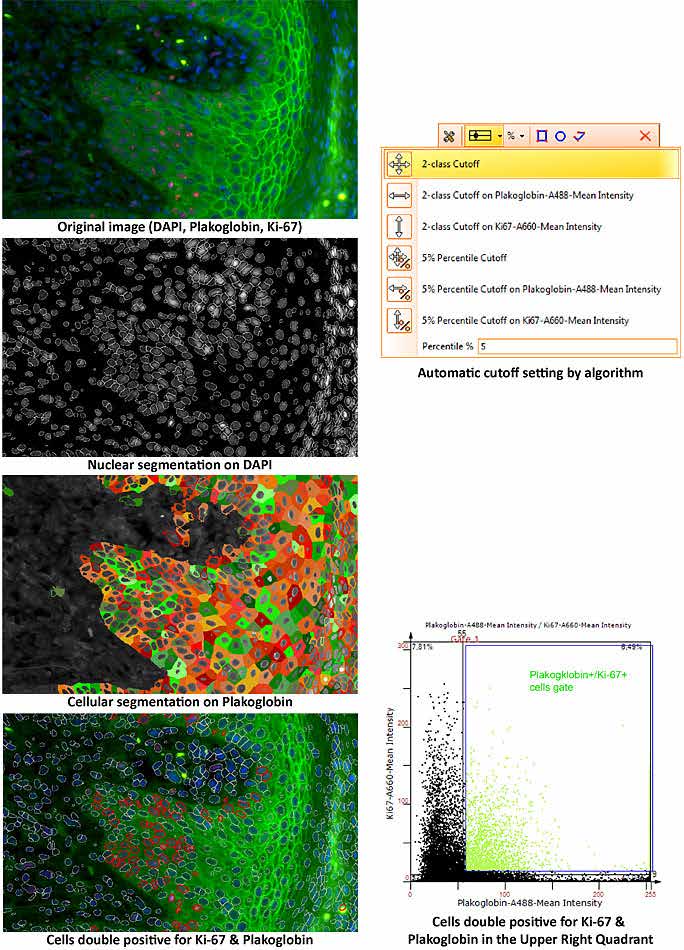
Nuclei detection based on DAPI staining is one of the most crucial first steps in image analysis; (a) here nuclei are outlined in green. Starting from this, the software defines the whole cell around the nuclei, outlined in yellow for representation (b); (c) detection of parasites inside the cell as shown here as pink dots; (d) combined masks showing cells in yellow and Leishmaniasis parasites in pink.

IF_Tumor_Foci_Angio_panel-min.png

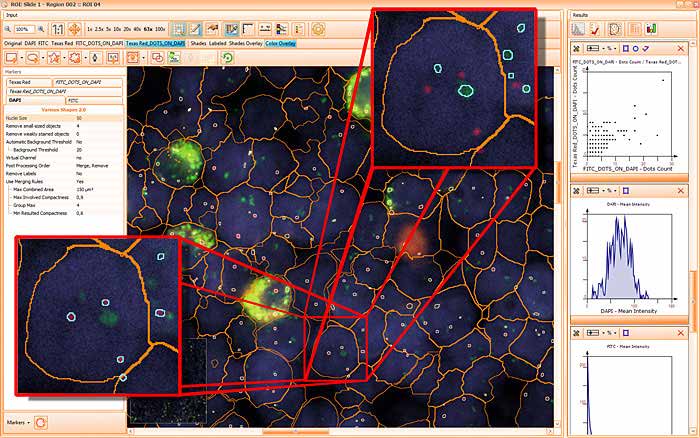
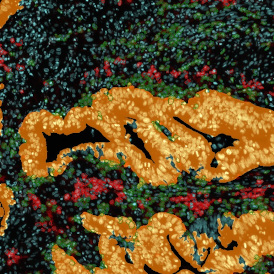
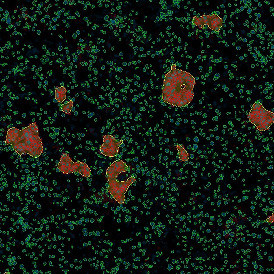
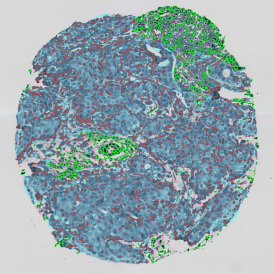
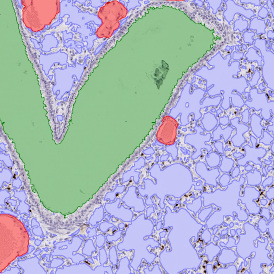
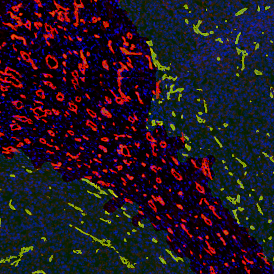
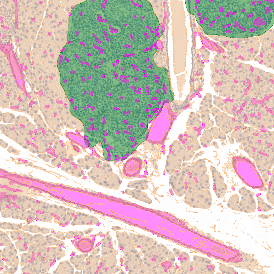
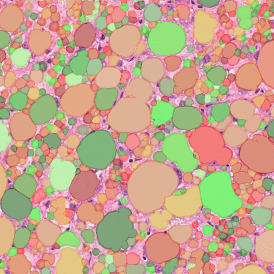
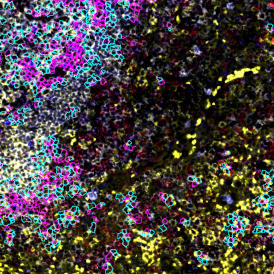
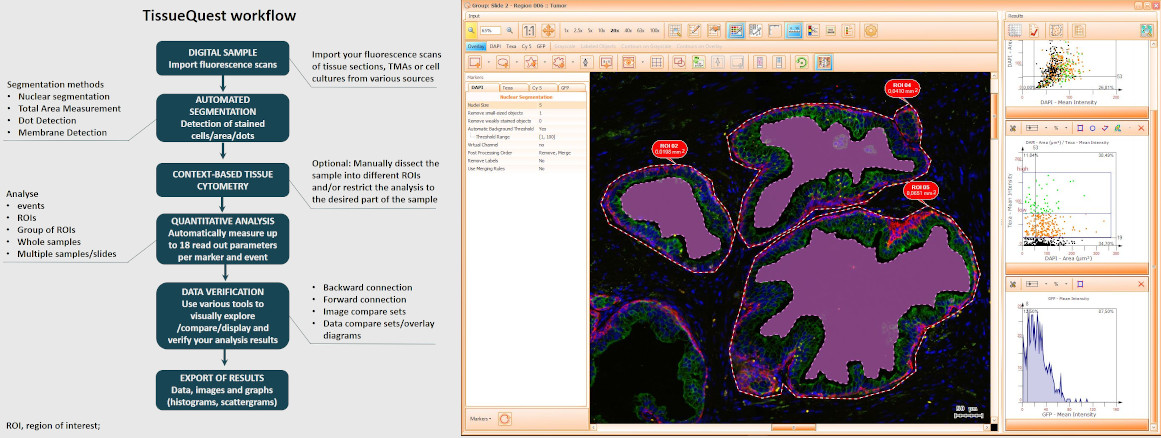
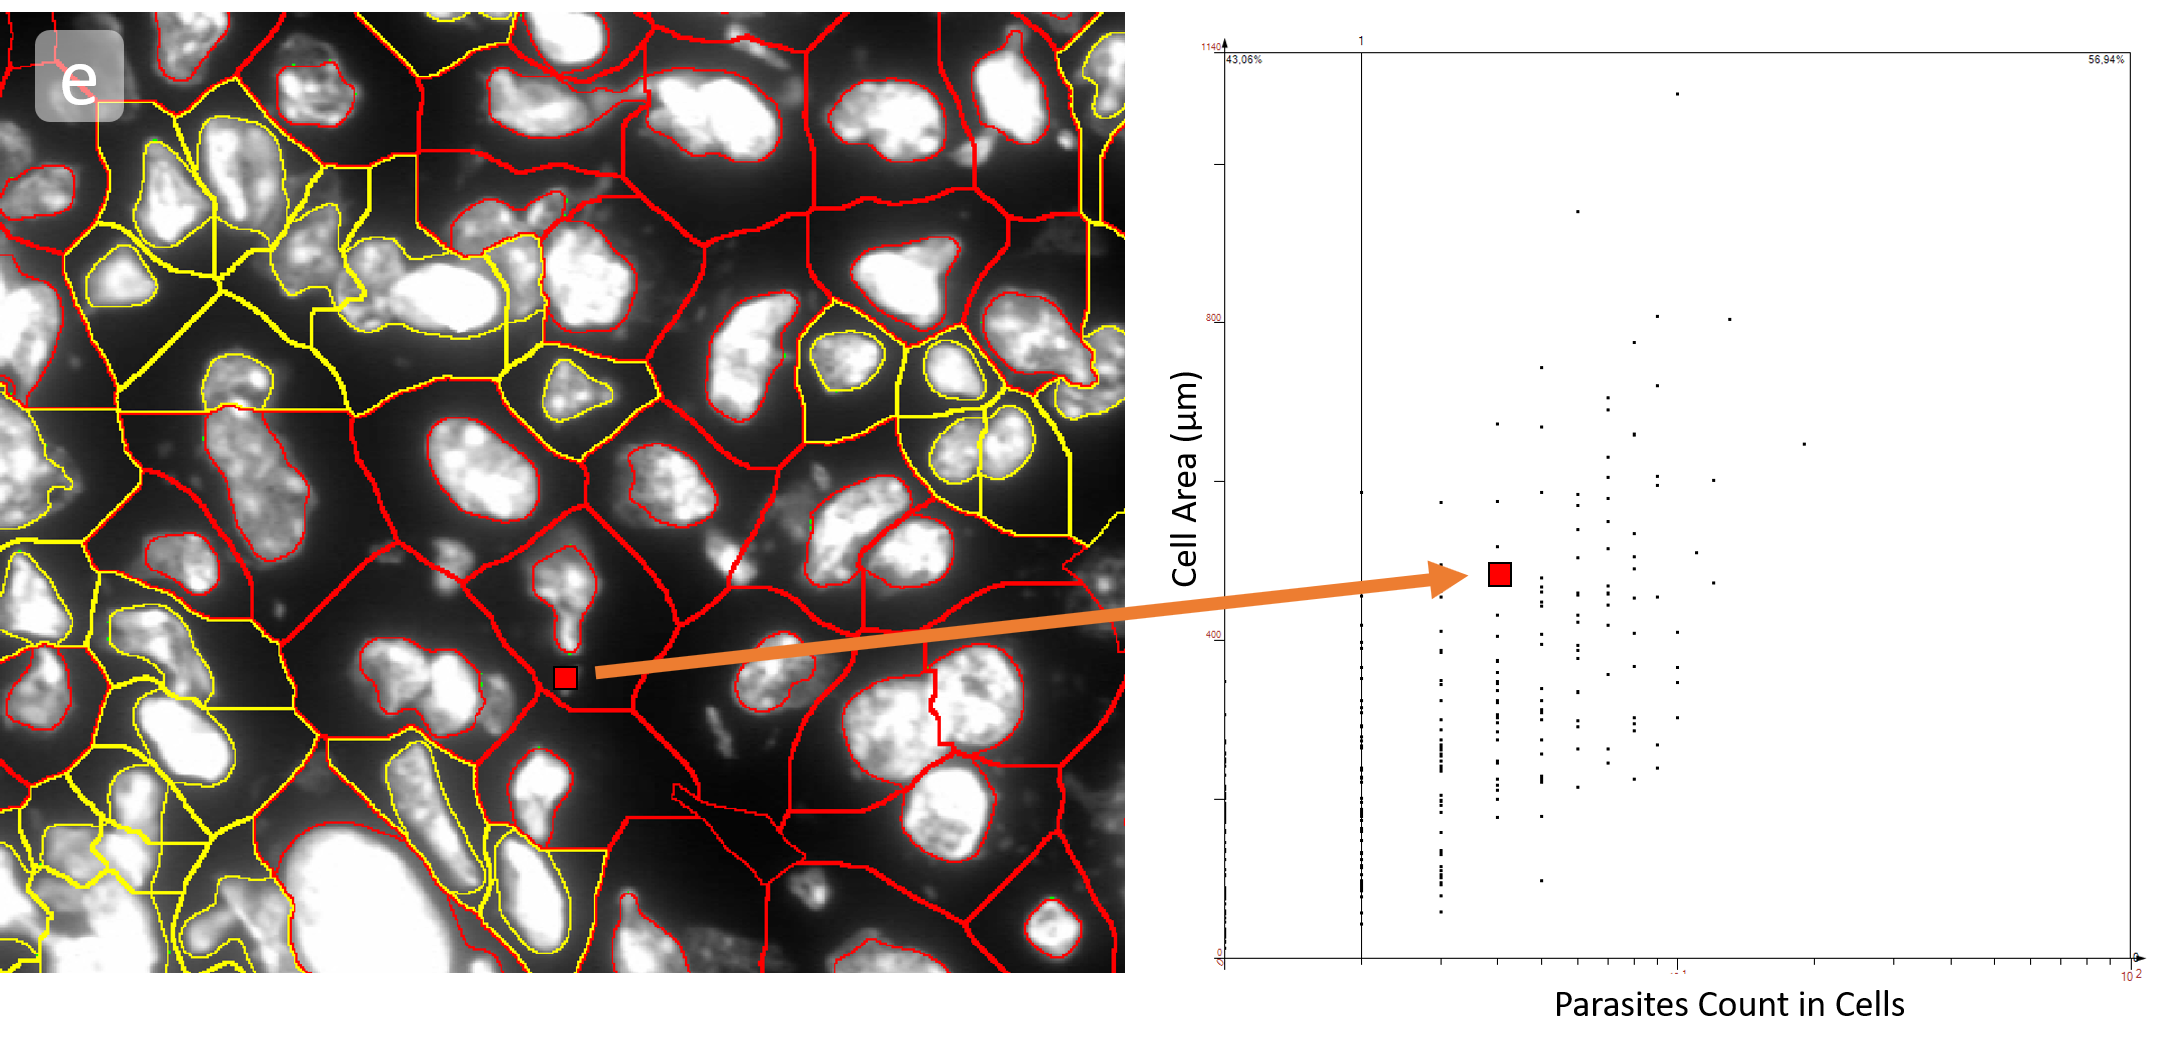
The obtained data is visualized within StrataQuest using scattergrams. In the example below, (e) cells containing parasites are highlighted in red by selecting them in the proper scattergram (in this case, parasites count vs cell size). The individual cells within an image can be chosen and their exact position in the corresponding scattergram is shown – this is a feature available in StrataQuest called forward connection, especially useful for validation of the selected gates.

IF_Tumor_Foci_Angio_scattergram.png

In the end, all results with many parameters to choose from can be outputted into common file formats (Excel, PDF, CSV) for further statistical analysis.

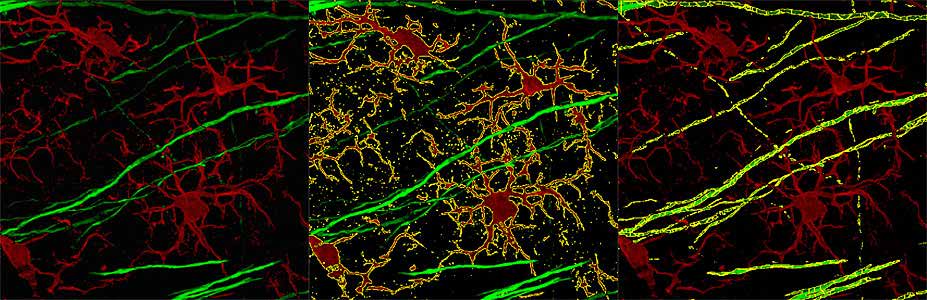
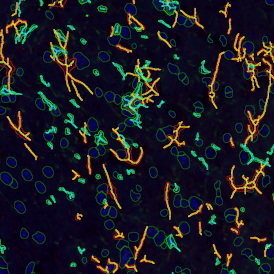
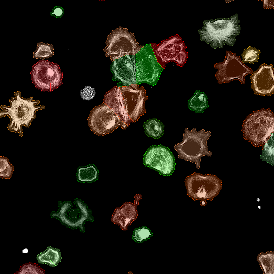
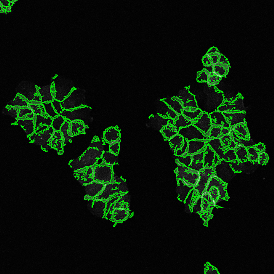
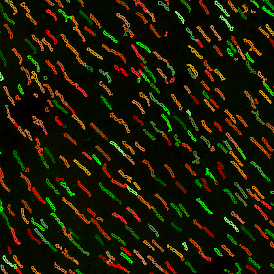
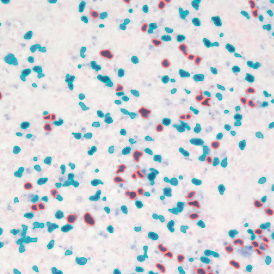
However, the power of StrataQuest´s App-based streamlined workflow does not end with cell/parasite detection. For further deciphering of Leishmania life cycle aspects and distribution processes, the parasite load and the status of parasite stages, e.g. “live/dead” can also be evaluated to obtain additive information. The IF Dots APP enables the analysis of FISH-stained leishmaniasis parasites.

A recent paper utilizing StrataQuest´s analysis software showed that programmed death-ligand 1 (PD-L1) expression is predictive of clinical response to treatment in patients with leishmaniasis [2]. If you are interested in performing detailed context-based quantitative analysis, explore the potential of StrataQuest and StrataQuest Apps.


Sources:

  1. Doehl JSP, Ashwin H, Brown N, Romano A, Carmichael S, Pitchford JW, Kaye PM. Spatial Point Pattern Analysis Identifies Mechanisms Shaping the Skin Parasite Landscape in Leishmania donovani Infection. Front Immunol. 2021 Dec 16;12:795554. doi: 10.3389/fimmu.2021.795554.
  2. Nidhi S. Dey, Paul M. Kaye, Shalindra Ranasinghe. Early reduction in PD-L1 expression predicts faster treatment response in human cutaneous leishmaniasis. October 5, 2021. J Clin Invest. 2021;131(22):e142765. doi.org/10.1172/JCI142765.
  3. TissueGnostics, 2022. White paper. PD-L1 raises new hope in the treatment of cutaneous leishmaniasis.

TissueQuest analysis automation

TissueQuests fully automated template based analysis is optimised for clinical routine and research applications and allows complete walk away operation. The user just has to load samples into an analysis project and to manually define regions of interest, if any are wanted. Then the template can be loaded, and analysis can be performed automatically.


The template provides:

  • Segmentation settings for all objects to be detected
  • A method for dealing with events in regions of interest (ROI)
  • Markers
  • Diagrams from the first sample of the project from which the template was saved
  • Statistics report settings
  • Simple report settings
  • Small dots settings 

TissueQuest image analysis algorithms

TGquest algorTissueQuest uses algorithms for nuclear and cell compartment segmentation, algorithms for stained area detection as well as algorithms for the detection of dots inside already detected cell compartments.

The nuclear segmentation algorithm is highly efficient in difficult situations in tissue and can be set with two values only - mean nuclear size and nuclear channel background threshhold. The cell compartment algorithm provides a large amount of flexibility with a few simple settings.

The images on the right show the segmentation of the nuclei based on DAPI (blue), the cellular segmentation based on Plakoglobin (green) and the assessment of Ki-67+ (red) and Plakoglobin+ (green)  cells. 

  
The total area algorithm segments stained areas in a sample (indicated in the image below).TGalgo2


The small dot algorithm provides small dot detection ideal for FISH and other applications in which the quantification of small objects within cellular compartments is needed. The image below shows the quantification of FITC and Texas Red FISH dots inside the nuclear compartment.

quantification of FITC and Texas Red FISH dots inside of the nuclear compartment.


TISSUE MICROARRAY
ANALYSIS SUPPORT

TissueQuest fully supports the analysis of Tissue Microarrays (TMA) scanned either with TG TissueFAXS systems or those slide scanners for which TissueQuest provides importers. For analysis projects of scans coming from TG TissueFAXS systems the autodetected TMA regions will be imported. For scans imported from other scanning systems without detected regions the TMA autodetection feature is also available in TissueQuest.

microarray

CAPABILITIES

 HistoQuest 7.1 TissueQuest 7.1StrataQuest 7.1
Available as a standalone software
Analyze tissue sections, TMAs, confluent cells, smears
Flourescence image analysis  
Brightfield image analysis  
Single cell analysis, total area measurements, dot detection (FISH, CISH, RNAScope), cytoplasmatic and membrane measurements
Contextual image analysis by manual ROI definition
Deep-learning nuclear segmentation
Machine-learning tissue classifier, metastructure detection, automated contextual tissue cytometry, proximity & distance measurements, Spatial relationships & tissue microenvironment analysis    
Highly customizable analysis development    
Apps with predefined analysis solutions    
Analysis of confocal/multispectral and time-lapse projects    

PROPERTIES

  
Operating System Windows 10 System
Platform compatibility TissueFAXS platform (.sqproj), StrataFAXS II (.vmic), Precipoint (.vmic, .gtif), OME-Tiff, Generic Big Tiff, Images (.jpeg, .tif, .bmp, .png), 3D Histech (.mrxs), Hamamatsu (.ndpi), Zeiss Axio Scan (.czi), Yokogawa, Aperio (.svs), Leica (.scn), Keyence, Perkin Elmer (.qptiff)
Export file compatibility Matlab, Python, ImageJ, FIJI, FCS express, most external command line engines

Contact

TissueGnostics GmbH
Taborstraße 10/2/8
1020 Vienna, Austria
+43 1 216 11 90
This email address is being protected from spambots. You need JavaScript enabled to view it.

We use cookies on our website. Some of them are essential for the operation of the site, while others help us to improve this site and the user experience (tracking cookies).
You can decide for yourself whether you want to allow cookies or not. Please note that if you reject them, you may not be able to use all the functionalities of the site.