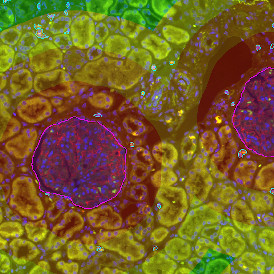
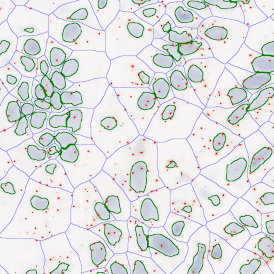
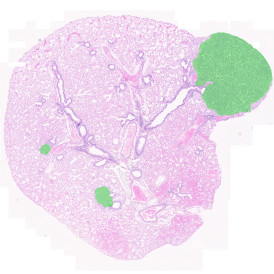
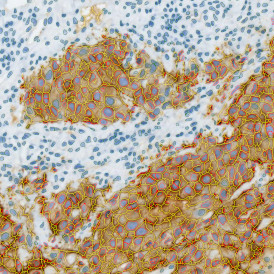
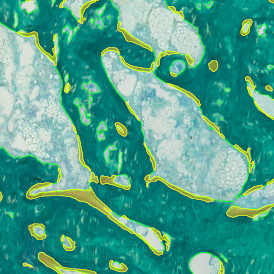
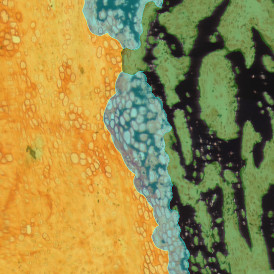
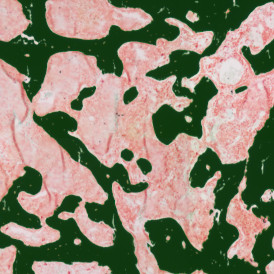
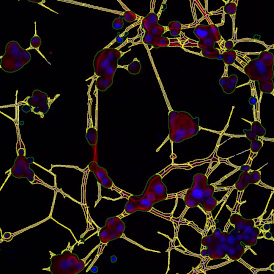
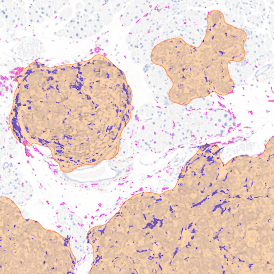
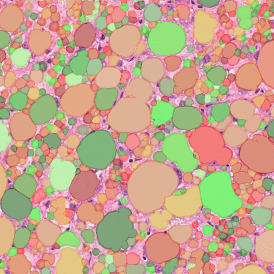
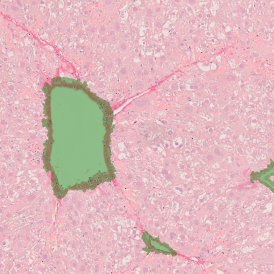
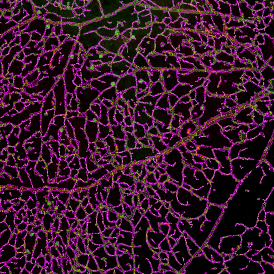
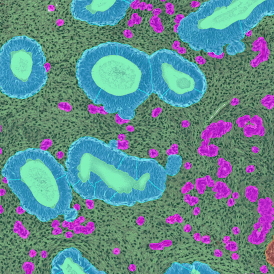
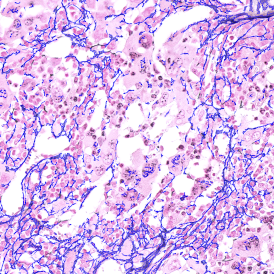
Brightfield APPs
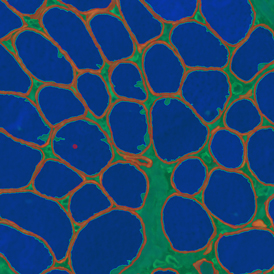
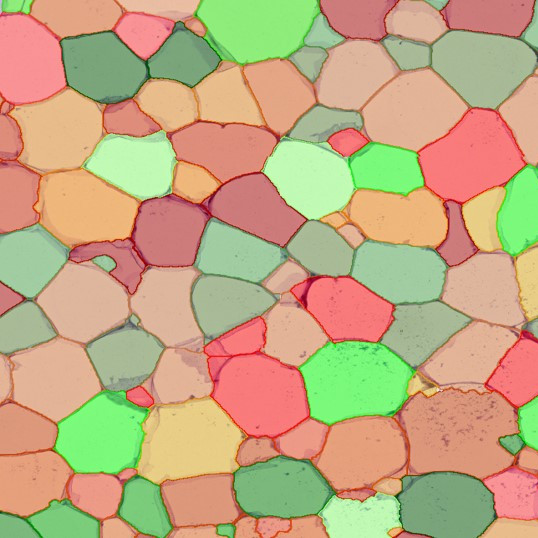
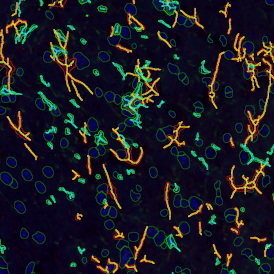
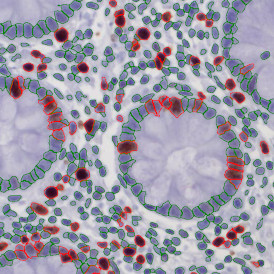
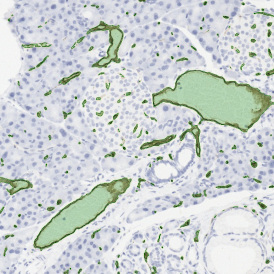
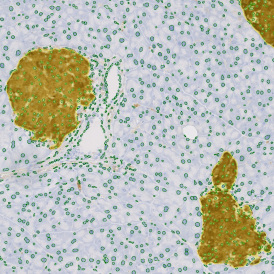
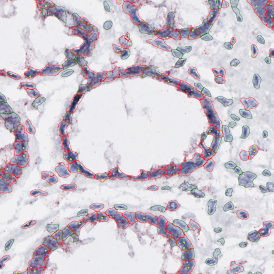
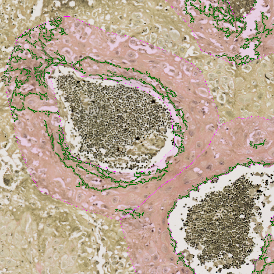
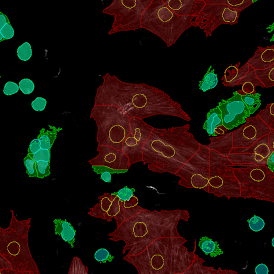
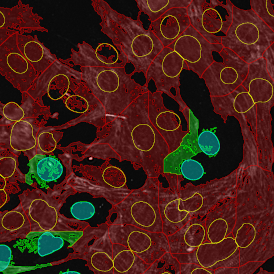
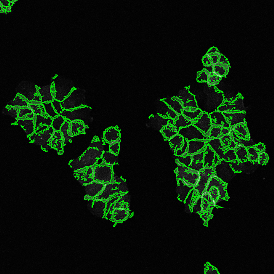
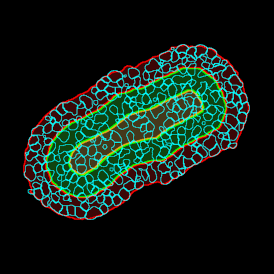
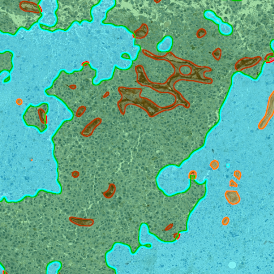
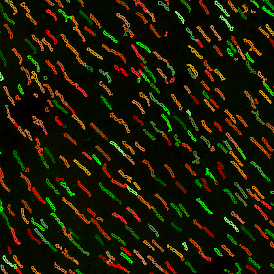
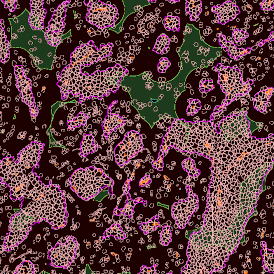
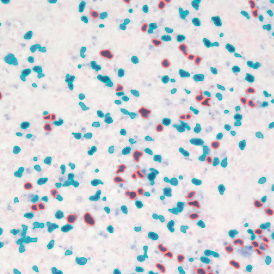
Brightfield APPs are designed to work on brightfield images and digital slides - usually these will be immunohistochemical stains, but for some requirements (e.g. fibrosis detection) histochemical stains can also be used and quantitatively evaluated. As opposed to immunofluorescence stainings, immunohistochemical stainings need to be color separated before being processed further for image analysis. In the following, find a representative selection of StrataQuest Brightfield APPs.
Please follow the links to explore our StrataQuest AI solutions and Fluorescence Apps.
BLOG UPDATE
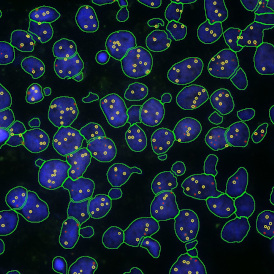
Cytometry encompasses several methods for investigating cells, such as their count, cell cycle state, phenotype, morphology, size etc. ...

NEWS
We have a lot of exciting plans to share for our big birthday, but we also have many important milestones to reflect on and remember...


Subscribe to our scientific Infoletter
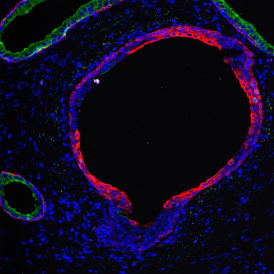
APP SHOWCASE
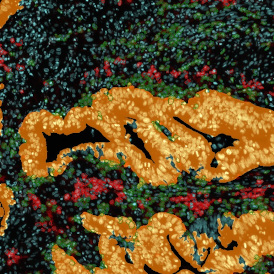
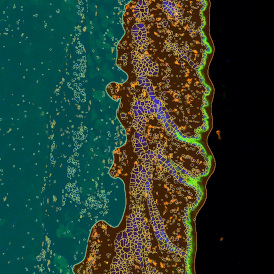
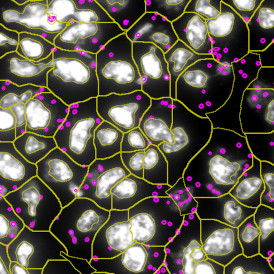
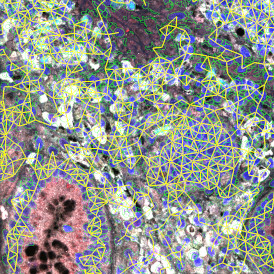
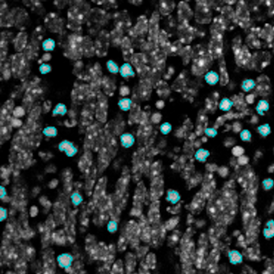
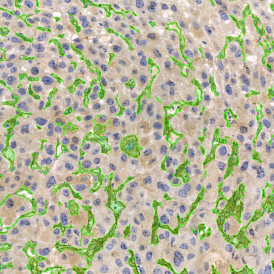
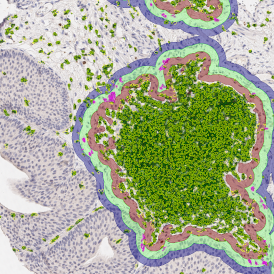
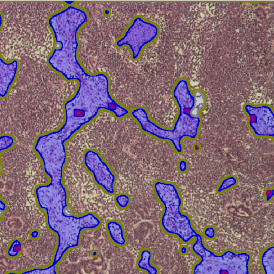
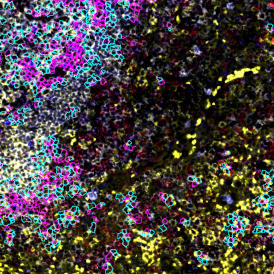
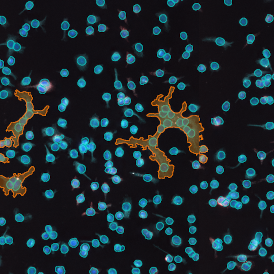
IHC IMMUNE SATUS IN SITU
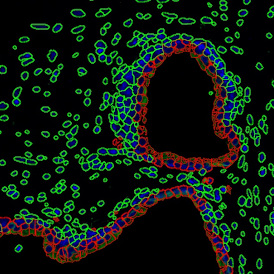
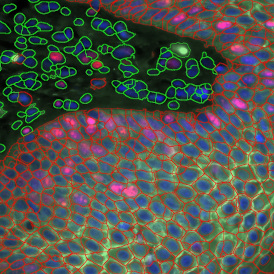
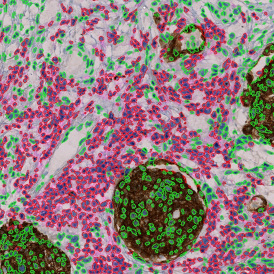
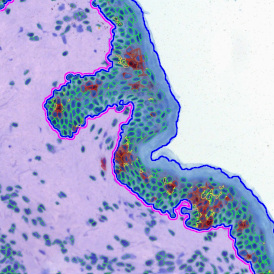
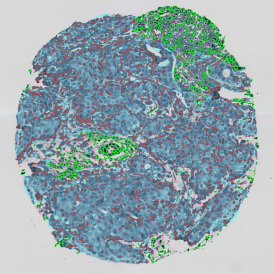
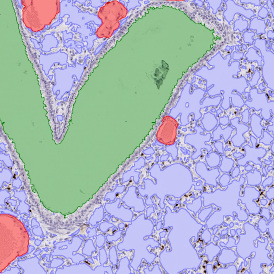
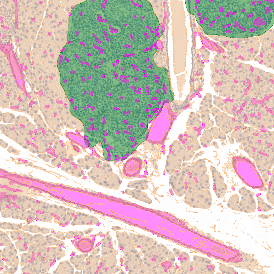
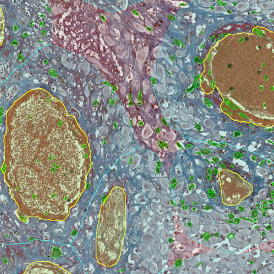
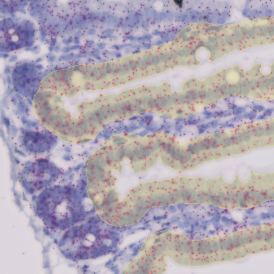
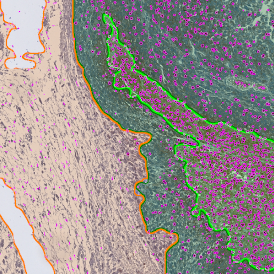
The IHC Immune Status in Situ App uses the AI classifier to segment tissue into morphological entities such as tumor, stroma, and lymphocyte clusters. It further identifies single cells ...

TOOLS
Reference Publications
Explore our online database of reference publications to find tout how tissue cytometry can elevate your research
TOOLS
StrataQuest Appcenter
Explore our vast catalog of analysis solutions in our Strataquest Appcenter and get inspired by the variety of applications.

TG ACADEMY WEBINAR
The Effect of Stem Cell Transplantation on Skin Microorganisms

Nadine Bayer, PhD
Medical University
of Vienna
Medical University
of Vienna
ARTICLE
Read about tissue cytometry's potential in understanding the complexities of cell populations in the tissue environment

Contact
TissueGnostics GmbH
Taborstraße 10/2/8
1020 Vienna, Austria
+43 1 216 11 90
This email address is being protected from spambots. You need JavaScript enabled to view it.