TG Academy Webinar - Decoding the language of cancer with SCellBOW
Dr. Namrata Bhattacharya, Peter MacCallum Cancer Centre, presents her work on SCellBOW (Single-Cell Bag-of-Words) - a novel computational approach that facilitates effective identification and high-quality visualization of single-cell subpopulations.
single-cell analysis
oncology
biomarker discovery
Transcriptomics
Webinar
TG Academy Webinar - Decoding the language of cancer with SCellBOW
12 Nov, 2025
Dr. Namrata Bhattacharya, Peter MacCallum Cancer Centre, presents her work on SCellBOW (Single-Cell Bag-of-Words) - a novel computational approach that facilitates effective identification and high-quality visualization of single-cell subpopulations.
Webinar Transcript
Decoding the Language of Cancer Using AI to Identify Hidden Treatment-Resistant Clones
Introduction
The topic I’m going to discuss today is decoding the language of cancer using artificial intelligence to reveal hidden clones that drive treatment resistance.
As Ruth mentioned, I am currently working as a postdoctoral fellow at the Peter MacCallum Cancer Centre, where our research is focused primarily on leukemia. However, the work I’m presenting today comes from my PhD research, which focused on applying AI approaches to prostate cancer. You will therefore see a strong influence of that work throughout this presentation.
Background: Single-Cell Data
I’ll begin with a brief introduction to single-cell data.
For many years, genomic analyses relied on bulk RNA sequencing. While bulk RNA sequencing provides high sequencing depth, it measures the average gene expression across all cells within a sample.
This means that cellular heterogeneity within tissues is masked.
This becomes a major problem in cancer research because tumors contain heterogeneous cellular clones, and our goal is often to identify rare and hidden clones that may drive disease progression or treatment resistance.
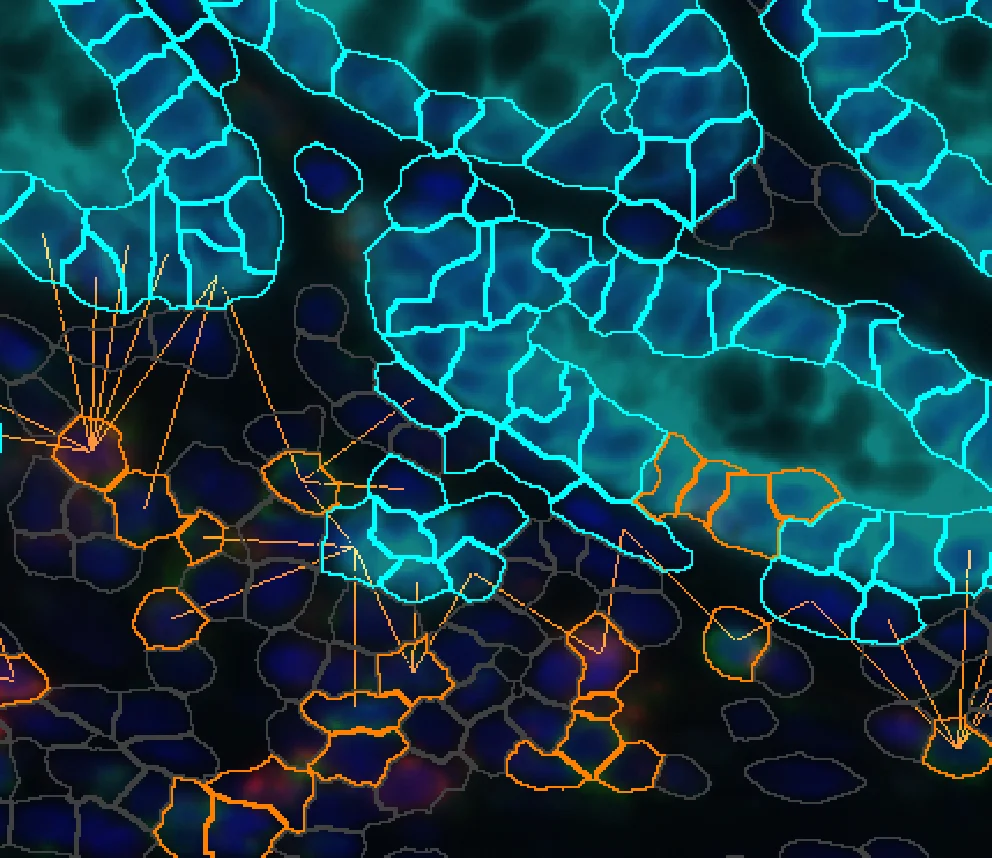
This challenge can be addressed using single-cell RNA sequencing (scRNA-seq). Unlike bulk sequencing, single-cell RNA sequencing measures gene expression at the level of individual cells, revealing the heterogeneity that is otherwise hidden in bulk data.
This technology enables researchers to explore:
- Intratumoral heterogeneity
- Intertumoral heterogeneity
- Tumor microenvironment diversity
- Rare cancer cell populations
Challenges with Single-Cell RNA Data
Despite its advantages, single-cell RNA sequencing presents several challenges.
1. Relatively New Technology
Single-cell RNA sequencing has only been widely used in the past decade. As a result, many analytical frameworks still rely heavily on knowledge derived from bulk RNA studies.
2. Dependence on Marker Genes
Many methods still rely on marker genes identified in bulk studies to characterize cellular phenotypes.
3. Limited Clinical Data
Because each cell is sequenced individually, linking clinical outcomes to single-cell phenotypes remains difficult.
4. Complexity of the Data
Single-cell datasets can contain tens of thousands of genes across thousands of cells, making analysis computationally challenging.
Research Question
This led us to ask:
Can we use AI to stratify tumor risk based on molecular phenotypes without relying on predefined marker genes?
Additionally, we asked:
Can knowledge from bulk RNA studies be transferred into single-cell analysis?
Conceptual Framework: Cells as Language
To address this problem, we considered a conceptual analogy:
What if cells could speak? What would their language tell us?
We modeled this as follows:
|
Biological Concept |
Language Analogy |
|---|---|
|
Cell |
Sentence / Document |
|
Gene |
Word |
|
Gene expression |
Word frequency |
In this analogy:
- Genes form the vocabulary
- Cells represent documents composed of words
- Gene expression defines how frequently words appear
By analyzing these patterns, we can infer cellular heterogeneity.
Applying Natural Language Processing (NLP)
To translate this concept into a computational approach, we used Natural Language Processing (NLP).
NLP is a field of artificial intelligence focused on analyzing and understanding human language.
In our framework:
- Cells are treated as documents
- Genes are treated as words
- Gene expression corresponds to word frequency
Term Frequency Matrix
A key NLP concept we used is the term frequency matrix.
In NLP, this matrix records how often each word appears in each document.
For example:
|
Word |
Document 1 |
Document 2 |
|---|---|---|
|
I |
1 |
1 |
|
You |
1 |
1 |
|
Jump |
2 |
1 |
Although both documents may contain the same words, their word frequencies differ, resulting in different semantic meaning.
We applied the same idea to single-cell data:
|
Concept |
NLP |
Biology |
|---|---|---|
|
Document |
Text document |
Cell |
|
Word |
Word frequency |
Gene expression |
Thus, each cell becomes a gene expression document.
The Core Model: Doc2Vec
To model this data, we used Doc2Vec, an unsupervised document embedding model.
Doc2Vec works similarly to modern language models like GPT. It converts text documents into numerical vectors called embeddings.
These embeddings represent the semantic meaning of documents.
If two documents contain similar words in similar contexts, their vector embeddings will be close together.
We apply the same concept to cells:
Cells with similar gene expression patterns produce similar embeddings.
Transfer Learning
We also incorporated transfer learning.
Transfer learning allows us to:
- Train a model on a large source dataset
- Transfer that knowledge to a smaller target dataset
Instead of training a neural network from scratch, we start with a pre-trained model whose weights are already optimized.
This is particularly useful because large datasets such as:
- Human Cell Atlas
- Mouse Cell Atlas
contain extensive single-cell information.
Our idea was to transfer knowledge from these atlases to new datasets.
The CellBOW Workflow
The resulting method is called CellBOW.
Step 1 — Data Input
We use two datasets:
- Source dataset (large atlas)
- Target dataset (dataset of interest)
Step 2 — Preprocessing
We perform:
- Gene filtering
- Cell filtering
- Log normalization
- Highly variable gene selection
- Z-score scaling
Step 3 — Bag-of-Words Representation
Each cell is converted into a document representation based on gene expression frequencies.
Step 4 — Pre-training
The model is trained on the large source dataset.
Step 5 — Fine-tuning
The trained model is applied to the target dataset.
Step 6 — Embedding Output
Each cell is represented as a numerical embedding vector.
Step 7 — Clustering
We perform clustering using Leiden clustering, visualized using UMAP.
Dimensionality reduction occurs in stages:
- ~60,000 genes
- → ~3,000 highly variable genes
- → 300-dimensional embedding
- → 2D visualization
Benchmarking CellBOW
To test the method, we evaluated it using three public datasets.
1. Normal Prostate Dataset
- Source: 120,000 cells
- Target: 28,000 cells
Purpose: test scalability.
2. PBMC Dataset
- Source: 68,000 cells
- Target: ~3,000 cells
Purpose: test performance on highly heterogeneous blood cells.
3. Pancreas Dataset
- Multiple sequencing technologies
- Used to test robustness to batch effects.
Comparison with Existing Methods
We compared CellBOW with several state-of-the-art tools:
Traditional clustering:
- Scanpy
- Seurat
Deep learning methods:
- DESC
- Sphere
Transfer learning methods:
- ItClust
- scArches
- scBERT
Evaluation Metrics
We evaluated clustering performance using:
Adjusted Rand Index (ARI)
Measures clustering accuracy.
Normalized Mutual Information (NMI)
Measures similarity between predicted clusters and true cell types.
Silhouette Index
Measures how well clusters are separated.
Performance Results
Across all datasets:
- CellBOW achieved the highest ARI scores
- CellBOW achieved the highest NMI scores
- Silhouette scores confirmed strong cluster separation.
This demonstrated high clustering accuracy and robustness.
Computational Efficiency
We also measured runtime performance.
For a dataset with ~14,000 cells:
|
Method |
Runtime |
|---|---|
|
ItClust |
2 minutes |
|
CellBOW |
3 minutes |
|
scArches |
~9 minutes |
|
scBERT |
~3 hours |
CellBOW therefore provides high accuracy with fast runtime, and it can run on standard hardware without requiring GPUs.
Phenotype Algebra: Ranking Tumor Clones
Clustering alone identifies cell populations, but it does not tell us which clones are aggressive.
To address this, we developed Phenotype Algebra, a marker-free method that ranks clones based on tumor aggressiveness.
This method builds on a property of language models called word algebra.
For example:
king − male + female ≈ queen
We apply similar vector arithmetic to cell embeddings.
Phenotype Algebra Workflow
Inputs:
- Single-cell RNA data
- Bulk RNA data with survival information
Steps:
- Convert single-cell clusters into pseudo-bulk profiles
- Combine pseudo-bulk and bulk datasets
- Generate embeddings using Doc2Vec
- Apply vector subtraction to evaluate clone impact
- Use a Random Survival Forest model trained on bulk survival data
This predicts aggressiveness scores for each clone.
Validation in Cancer Datasets
We validated this method in several cancers:
Breast Cancer
Correctly ordered subtypes by aggressiveness:
- Luminal A
- Luminal B
- HER2
- Basal
Glioblastoma
Identified correct hierarchy:
- Proneural (least aggressive)
- Mesenchymal
- Classical (most aggressive)
Prostate Cancer
Correctly ranked:
- AR-high
- AR-low
- Neuroendocrine (most aggressive)
Identifying Tumor Microenvironment Cells
Phenotype Algebra can also distinguish:
- Tumor cells
- Immune cells
- Stromal cells
- Extracellular matrix cells
This allows separation of cancerous and non-cancerous cell populations.
Discovery of Novel Aggressive Clones
When applying CellBOW and Phenotype Algebra to prostate cancer data, we discovered a previously unidentified aggressive clone.
Characteristics:
- Present across multiple patients
- Contains mixed subtype signatures
- Associated with:
- Stemness
- Metastasis
- EMT pathways
- Drug resistance
- Angiogenesis
This suggests a novel aggressive prostate cancer clone.
Additional Applications
The method can also be used for:
Validating Cell Type Annotation
We compared results with SCType annotations and found cases where our method correctly identified misclassified tumor clusters.
Summary
In summary:
- CellBOW is an AI-based single-cell clustering method using NLP embeddings.
- Phenotype Algebra ranks tumor clones by aggressiveness.
- The combined framework can:
- Identify cellular heterogeneity
- Detect rare clones
- Rank tumor aggressiveness
- Discover novel cancer subtypes
Acknowledgements
I would like to thank:
- My PhD supervisors at QUT
- Dr. Debarka from IIIT Delhi
- Brett, Anna, and Melanie for their support
- My current supervisor Mark Dawson at Peter MacCallum Cancer Centre
- Our collaborators who provided datasets
And of course, the institutions that supported this work.
Thank you.