
IF Cultured Cells & Substructures
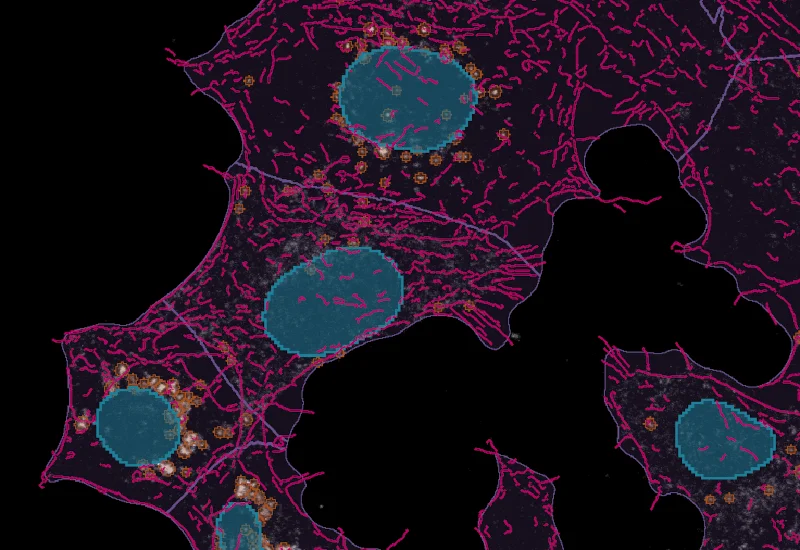
Detect nuclei-based cells, quantify dot markers per cell, and measure cytoskeletal filament density and dot intensity at single-cell level.
FISH, cell culture, cytoskeleton, actin fibres
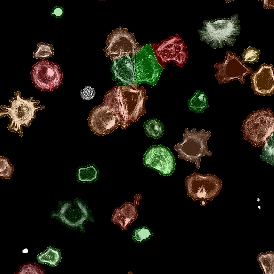
The IF Cultured Cells & Substructures App detects cells based on nuclei staining, as well as one dot marker (FISH, CISH experiments) and cytoskeletal structures based on a specific stain. It outputs the number of detected cells, the number and intesity of dots per cell and the density of cytoskeletal filaments.
Original Image
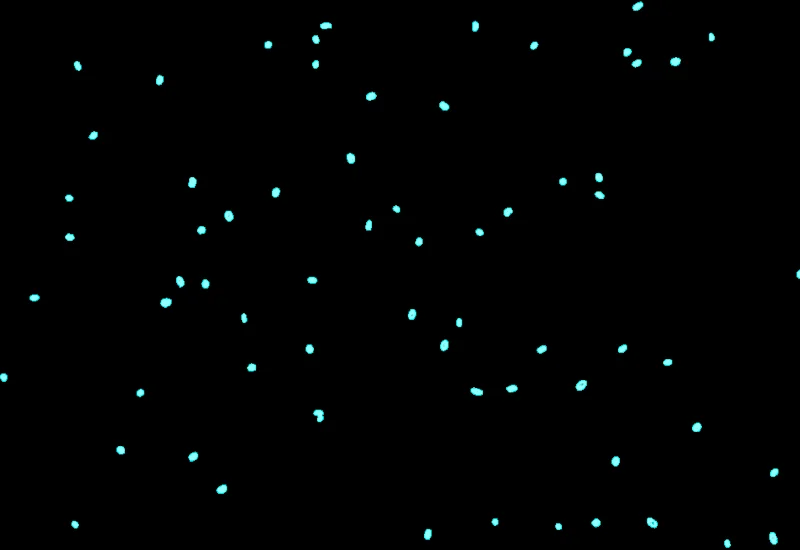
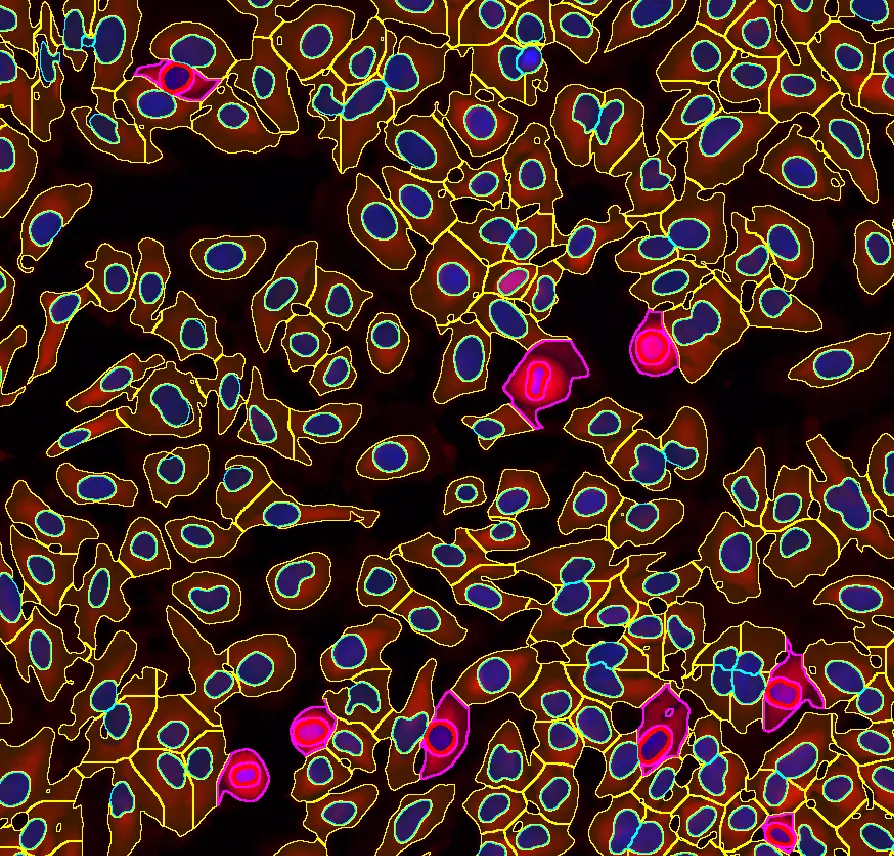
Nuclei detection
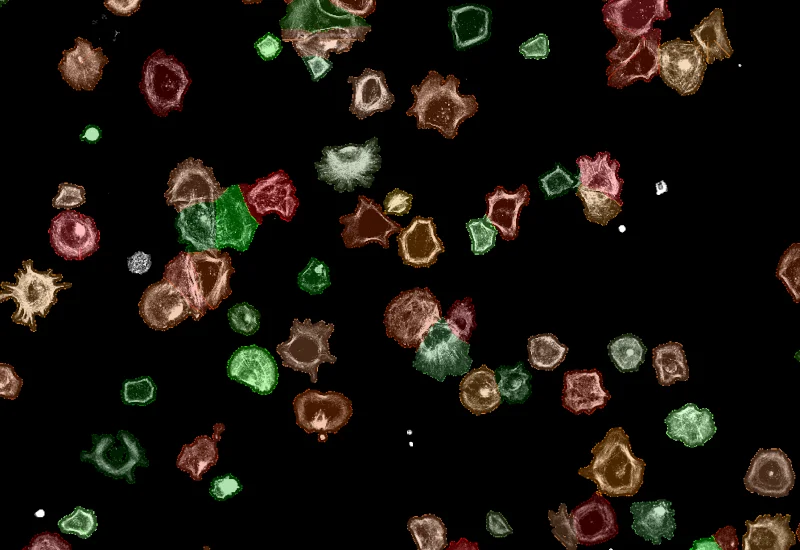
Cell detection
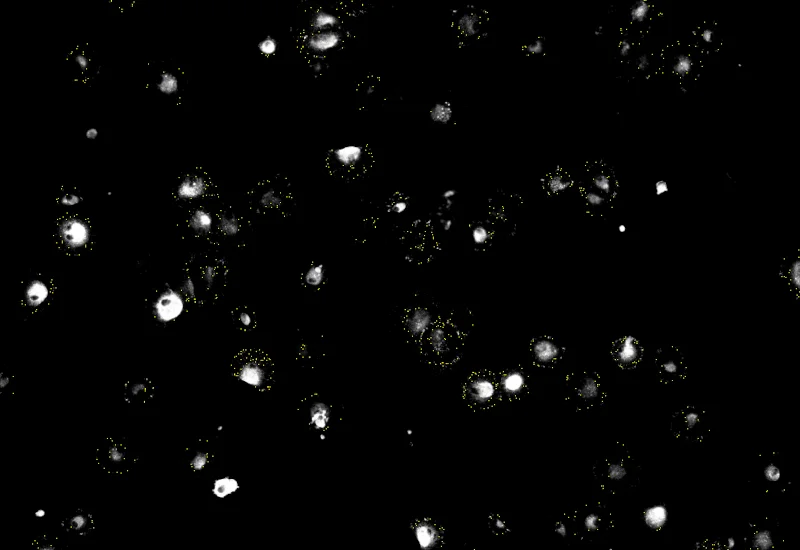
Dot detection
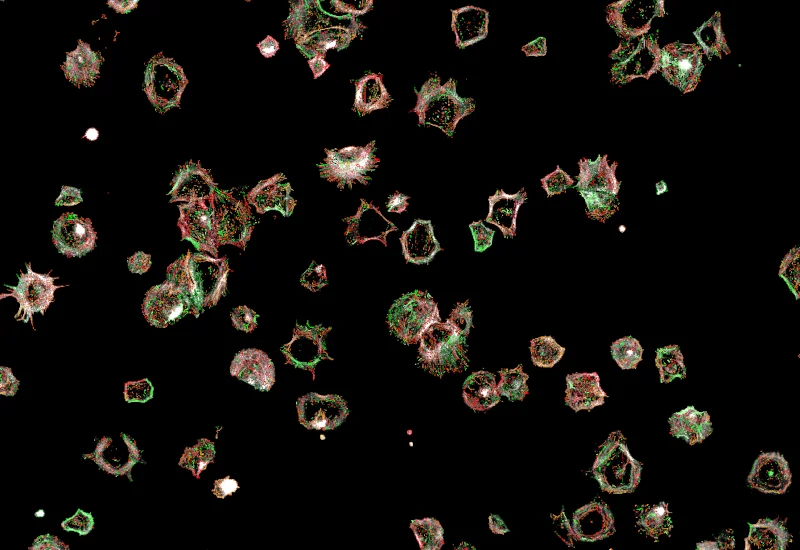
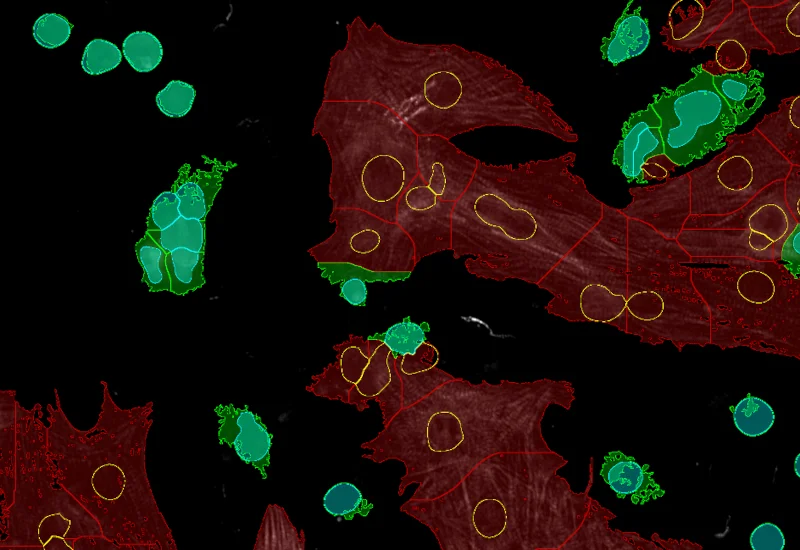
Filament detection
Blog Post
15 Feb, 2023
Applications of AI in Cell Segmentation
Application Note
14 Oct, 2024
Quantitative Analysis of Cultured Cells
Webinar
12 Nov, 2025
TG Academy Webinar - Decoding the language of cancer with SCellBOW
Application Note
14 Oct, 2024
Quantitative Analysis of Cultured Cells
We support the following file formats:
- TissueFAXS (aqproj)
- StrataFAXS II (vmic)
- PreciPoint (vmic, gtif)
- Generic BigTIFF Import
- Support for multipage BigTIFF files
- OME-TIFF
- JPEG, PNG, BMP, TIFF
- Zeiss (czi)
- Hamamatsu NanoZoomer (ndpi)
- Aperio (svs)
- Leica (scn)
- 3D HISTECH Pannoramic
- Mirax (mrxs)
- Olympus (vsi)
- More slide scanners to be added!
Related Apps
IF Cardio Cell Culture
Detect nuclei and identify cardiomyocytes in IF-stained cell cultures, reconstruct cytoplasmic masks, and quantify cardiomyocyte number, area, and marker intensity.
cardiology, cardiomyocytes, cell culture, fibroblasts, troponin red
IF Cytoskeleton
Detect cytoskeletal structures by specific stain, identify cytoplasm with additional markers, and export filament count (inside, outside, membrane), filament length, and total filament area.
actin, cytoskeleton, cortical fibres, microfilaments, stress fibres, cell culture, fluorescence

IF Dots
Detect dots-stainings per cell in up to four markers, segment cellular compartments, measure up to 20 intensity, statistic, and morphometric parameters, and quantify dot count, mean intensity, total area, intensity sum, and per-dot area/intensity per compartment.
cell culture, breast cancer, fluorescence, HER2
Custom App development
Perfectly tailored image analysis solutions for your research.
You have a specific research question that needs to be answered? We offer custom development of image analysis pipelines for specific tasks, be it detection of cellular phenotypes or quantification of tissue structures. After discussing your goals with one of our experts, you will get a ready-to-use App and be a step closer to an impactful publication.
