
Mapping spatial cell-to-cell interactions in tertiary lymphoid structures with spatial proteomics
Our latest application note demonstrates how StrataQuest can transform complex spatial proteomics data derived from Imaging Mass Cytometry in quantitative insights.
spatial analysis
tumor microenvironment
immunophenotyping
imaging mass cytometry
Application Note
Mapping spatial cell-to-cell interactions in tertiary lymphoid structures with spatial proteomics
06 Jul, 2026
Understanding the tissue microenvironment is vital to our understanding of ongoing local processes, including immune responses, as cells naturally co-exist in a shared space and thus are directly influenced by their neighbors. These influences ultimately shape the cell fate and under certain pathological conditions may lead to a number of diseases – particularly, cancer.
The task of investigating cell-to-cell dynamics and spatial distribution of relevant phenotypes in the tissue is not a trivial one. Among other imaging methods, Imaging Mass Cytometry (IMC) offers high-plex imaging of tissue sections by using metal-coupled antibodies against targets of interest. IMC can visualize up to 50 markers and therefore enable an in-depth analysis of the tissue microenvironment. While this approach has several advantages in comparison to conventional multiplex immunofluorescence, subsequent image analysis requires a platform designed for handling multi-parametric spatial data.
Here, we show how StrataQuest, TissueGnostics’s flagship image analysis solution, delivers spatial biology insights to investigate the immune cell interactions in situ. The main goal of this analysis was to detect and quantify lymphocyte and myeloid subpopulations and to characterize their spatial distribution in the tissue. Furthermore, we aimed to assess the cellular composition of tertiary lymphoid structures (TLS) as key players in anti-tumoral immunity and explore their proximal cell neighborhoods.
The presented end-to-end analytical pipeline can be generally subdivided into three main steps: cell segmentation, phenotyping and spatial assessment of cell-to-cell and cell-to-structure relationships.
First, we applied a segmentation algorithm, which combines integrated Cellpose model (Stringer & Pachitariu, 2020) and classical thresholding, on a nuclei channel image (Figure 1A). This step serves as a foundation for subsequent identification of main cellular phenotypes in this study (Figure 1B): CD45+ leukocytes, CD45+CD20+ B cells, CD45+CD3+ T cells, CD31+ endothelial cells, CD45+CD68+ macrophages, CD45+CD66+ neutrophils, CD45+CD11c+ dendritic cells. To further characterize T cell subsets, we focused on CD4+ T helper (Th) and CD8+ cytotoxic T lymphocytes (CTLs) and their subpopulations.
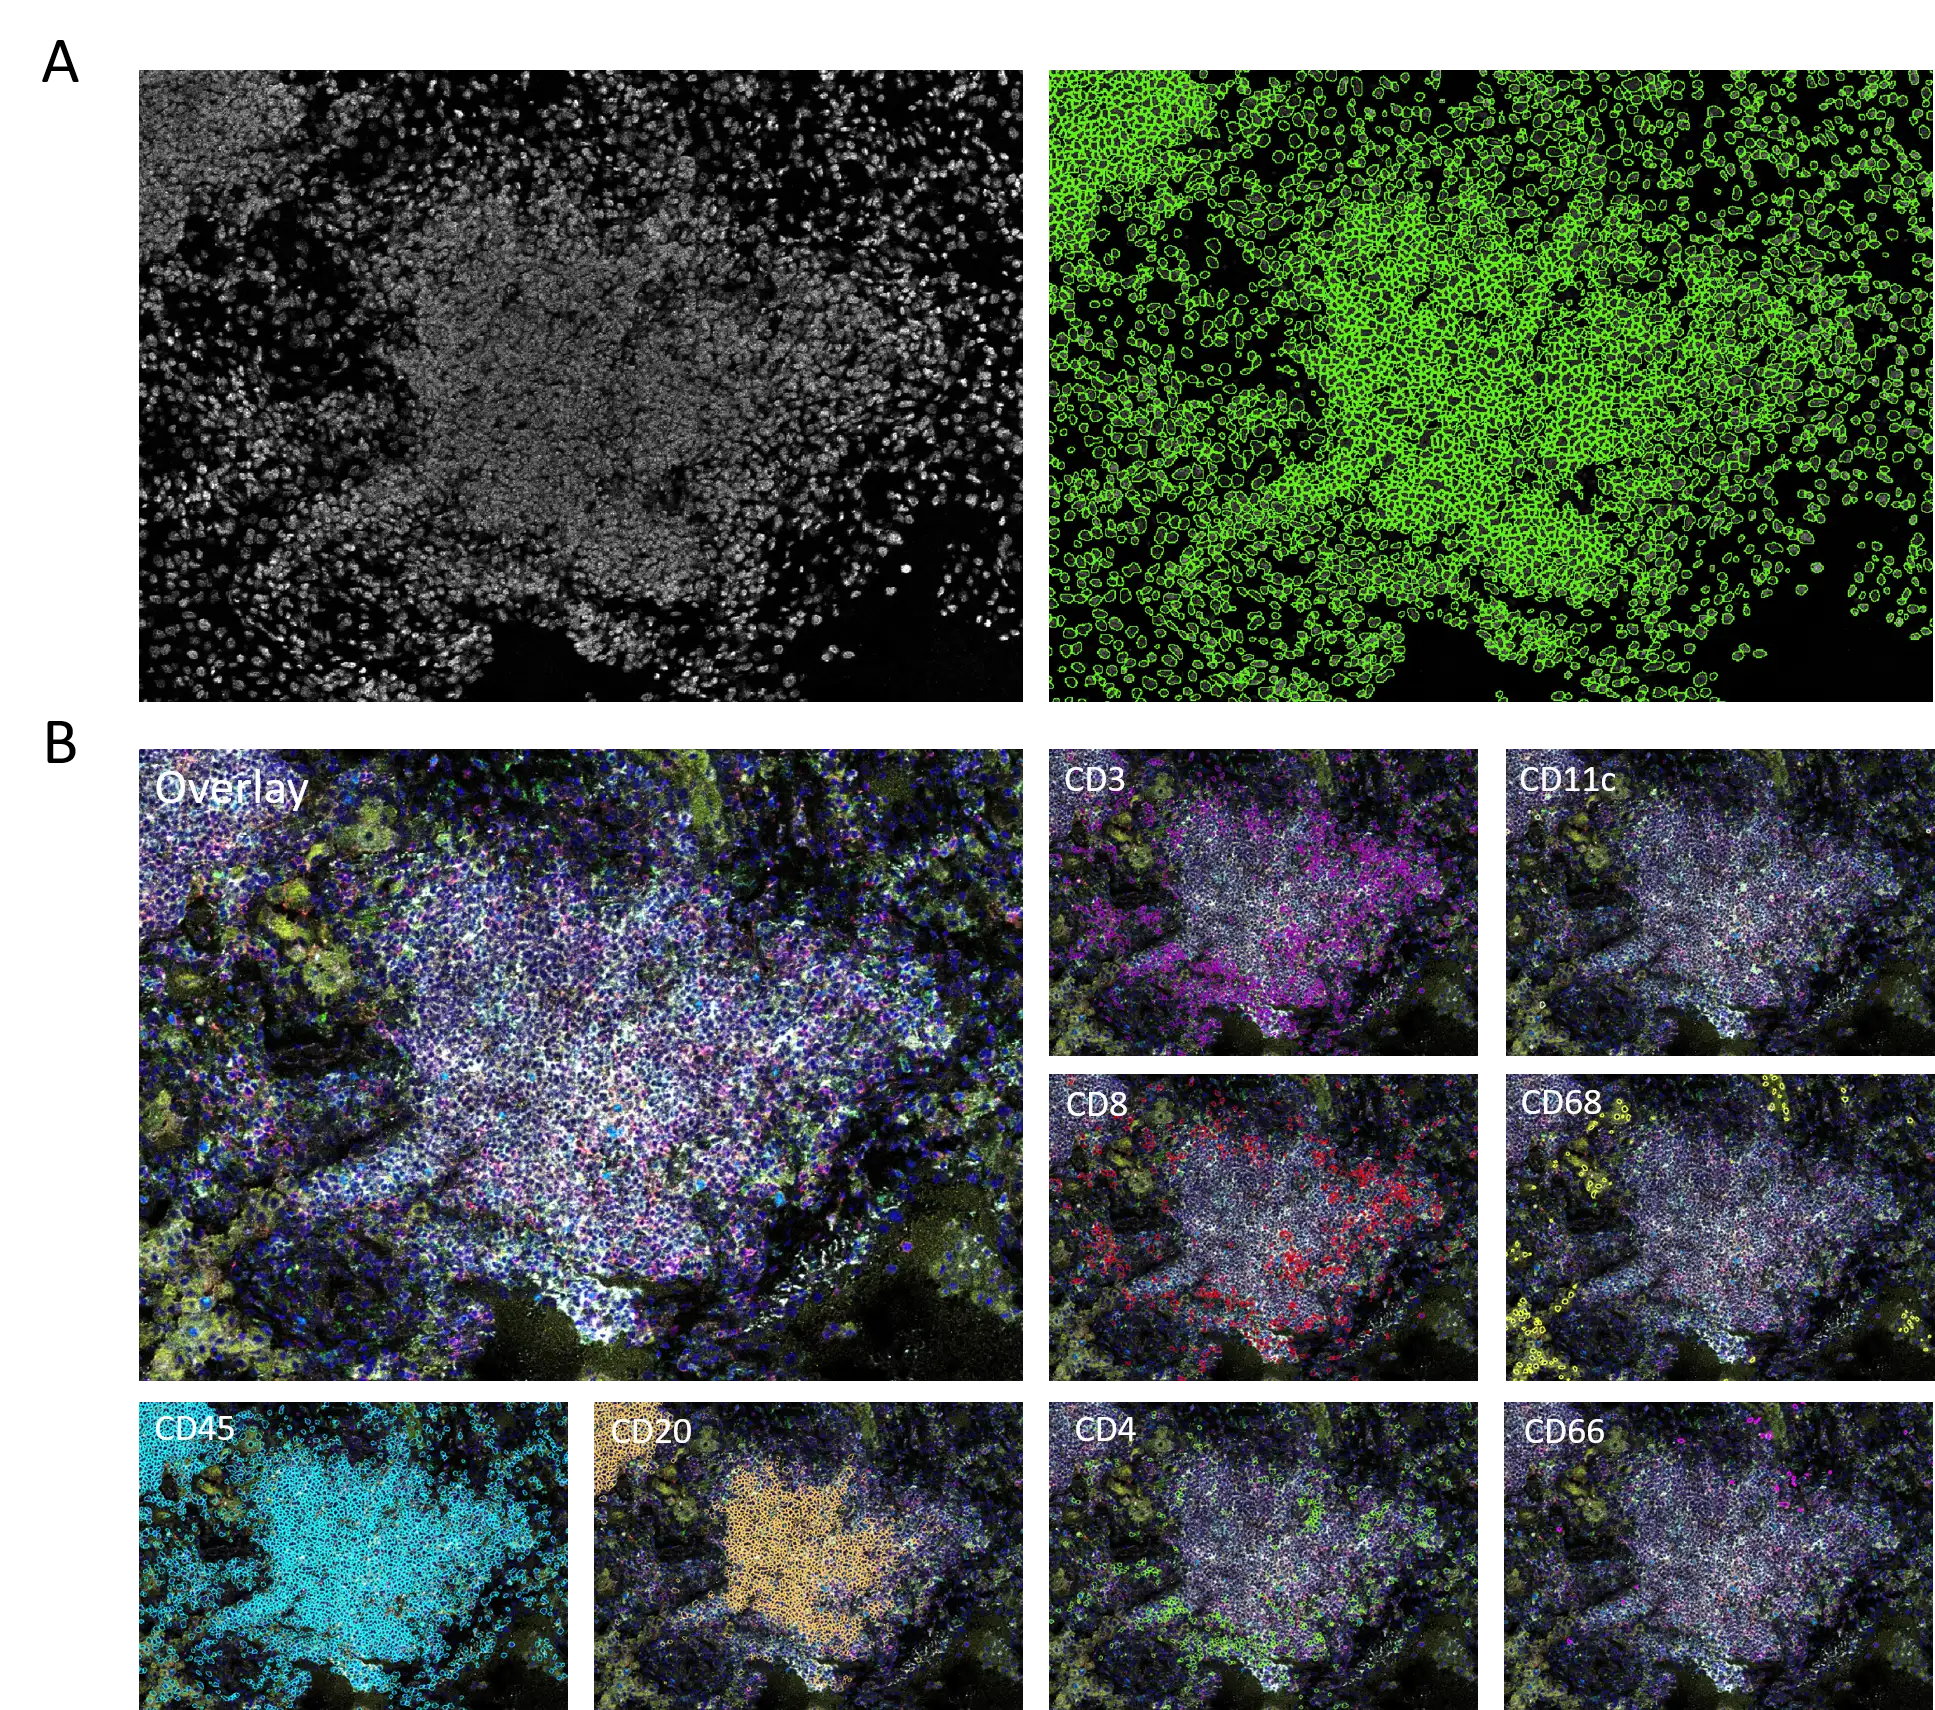 Figure 1. (A) Nuclei segmentation masks (right) based on the nuclei channel (left). (B) Marker-based phenotyping of main immune cell types (lymphocytes and myeloid cells).
As next, we’ve identified several CD20-enriched TLS, present in the tissue, indicating ongoing immune activation processes. Using the StrataQuest AI-powered classifier engine, we defined separate TLS, stroma and background classes (Figure 2). Identified TLS mask allowed us to generate a proximity map in 25 µm steps away from TLS – to investigate cell types closest or furthest away from the structure.
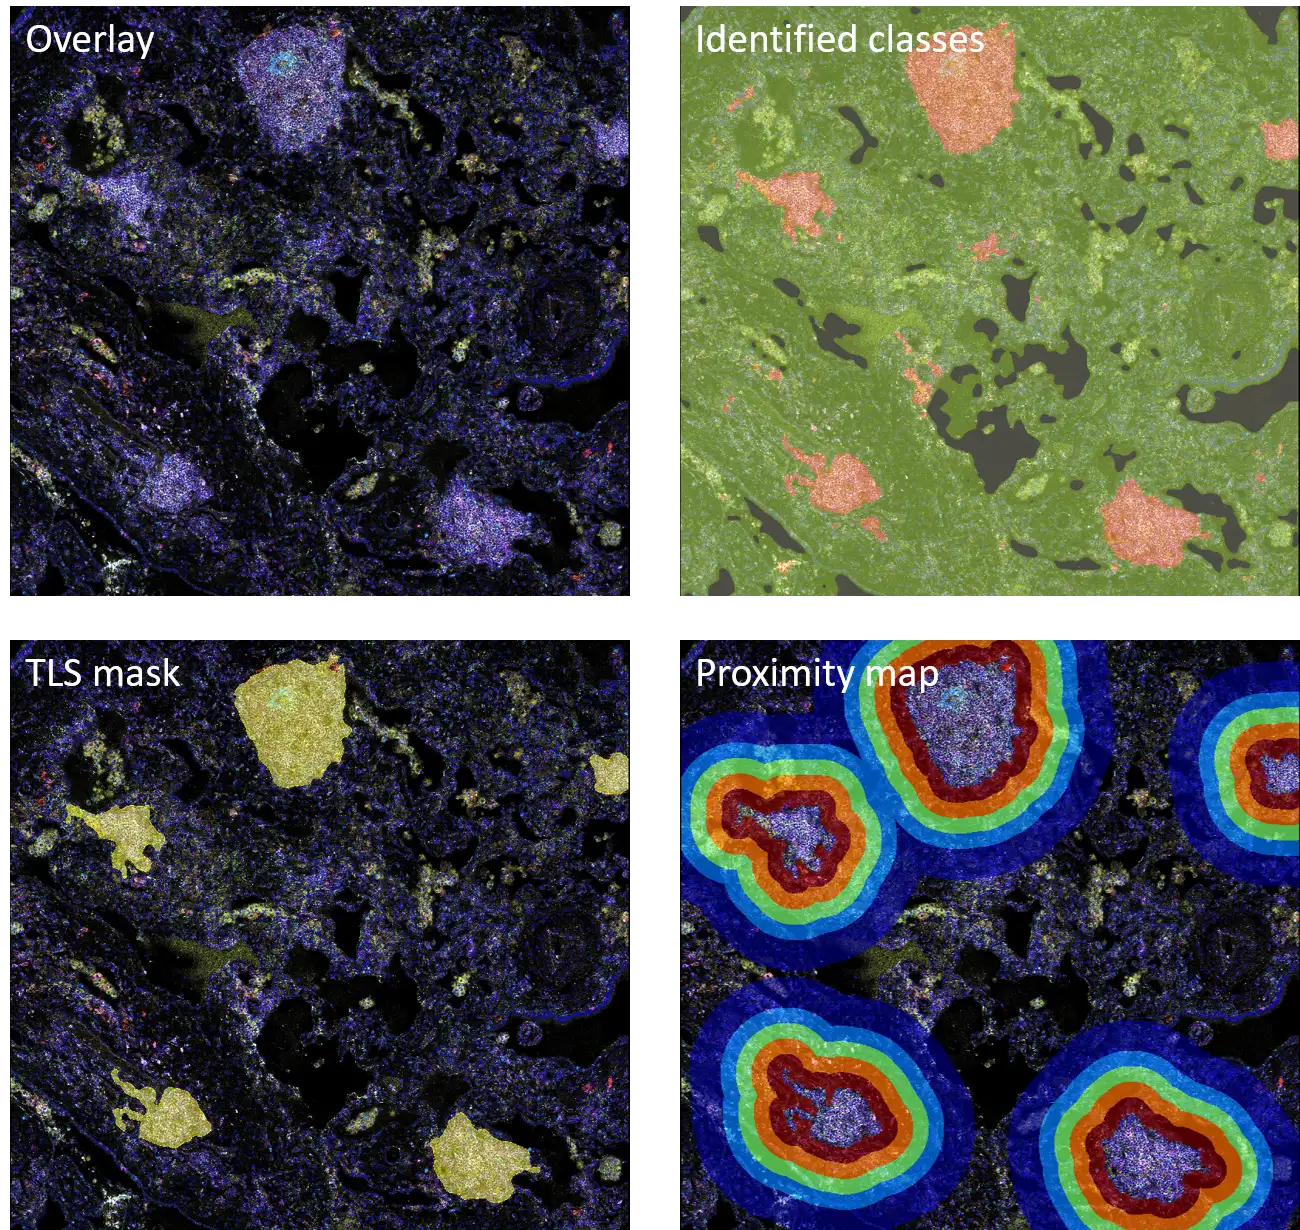 Figure 2. TLS detection and proximity map generation.
To better understand the spatial landscape of the tissue, we compared the spatial distribution of B cells, CD4+ and CD8+ T cells as well as macrophages across tissue compartments (Figure 3A): inside TLS, in the proximity to TLS (up to 100 µm) and over 100 µm from TLS.
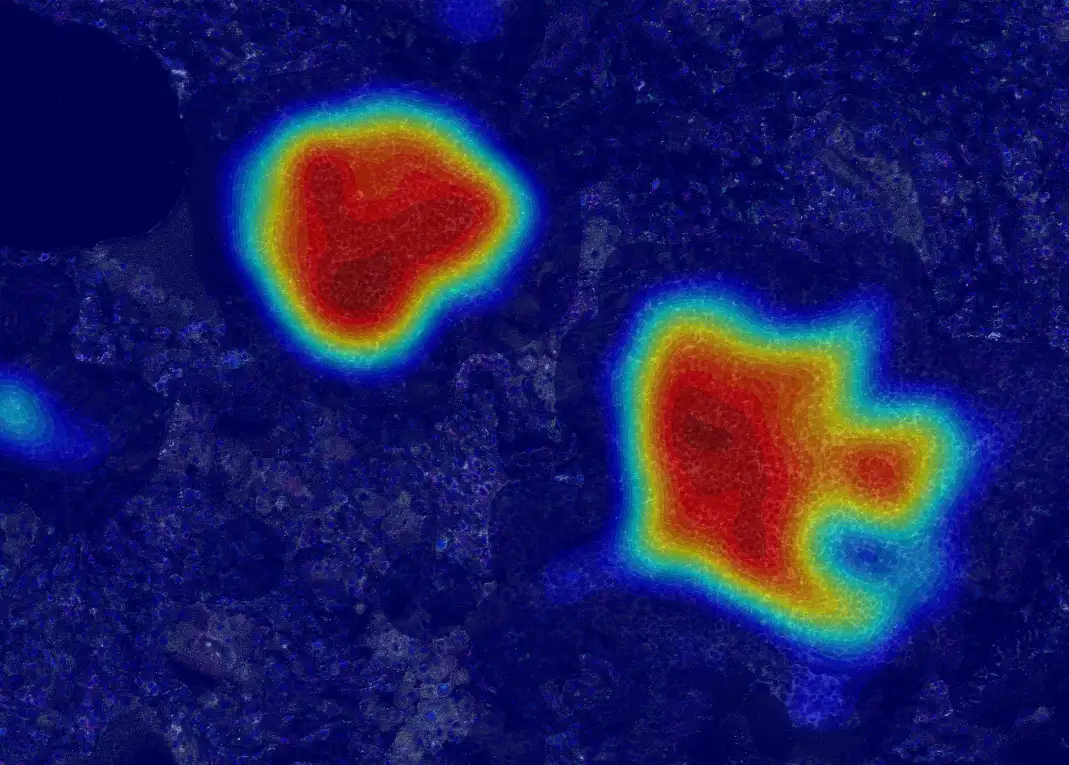
Inside TLS, B cells comprised almost a half of all cells and are practically not found anywhere else (Figure 3B), while T cells take up around a third of total cell population. High density of B cells in TLS allows for TLS identification as B cell hotspots, represented as a heatmap (Figure 3B). Myeloid cells (including macrophages, dendritic cells and neutrophils), however, collectively reach around 1.5% in TLS and are more often found beyond TLS boundary. Notably, CD8+ CTLs were found to represent a prevalent T cell type both in TLS and in stroma, potentially attributable to an active anti-tumoral immune response. Overall, quantitative spatial analysis, generated in StrataQuest, supported the data from literature on TLS composition, highlighting the platform’s robustness in analyzing compositional complexity of TLS.
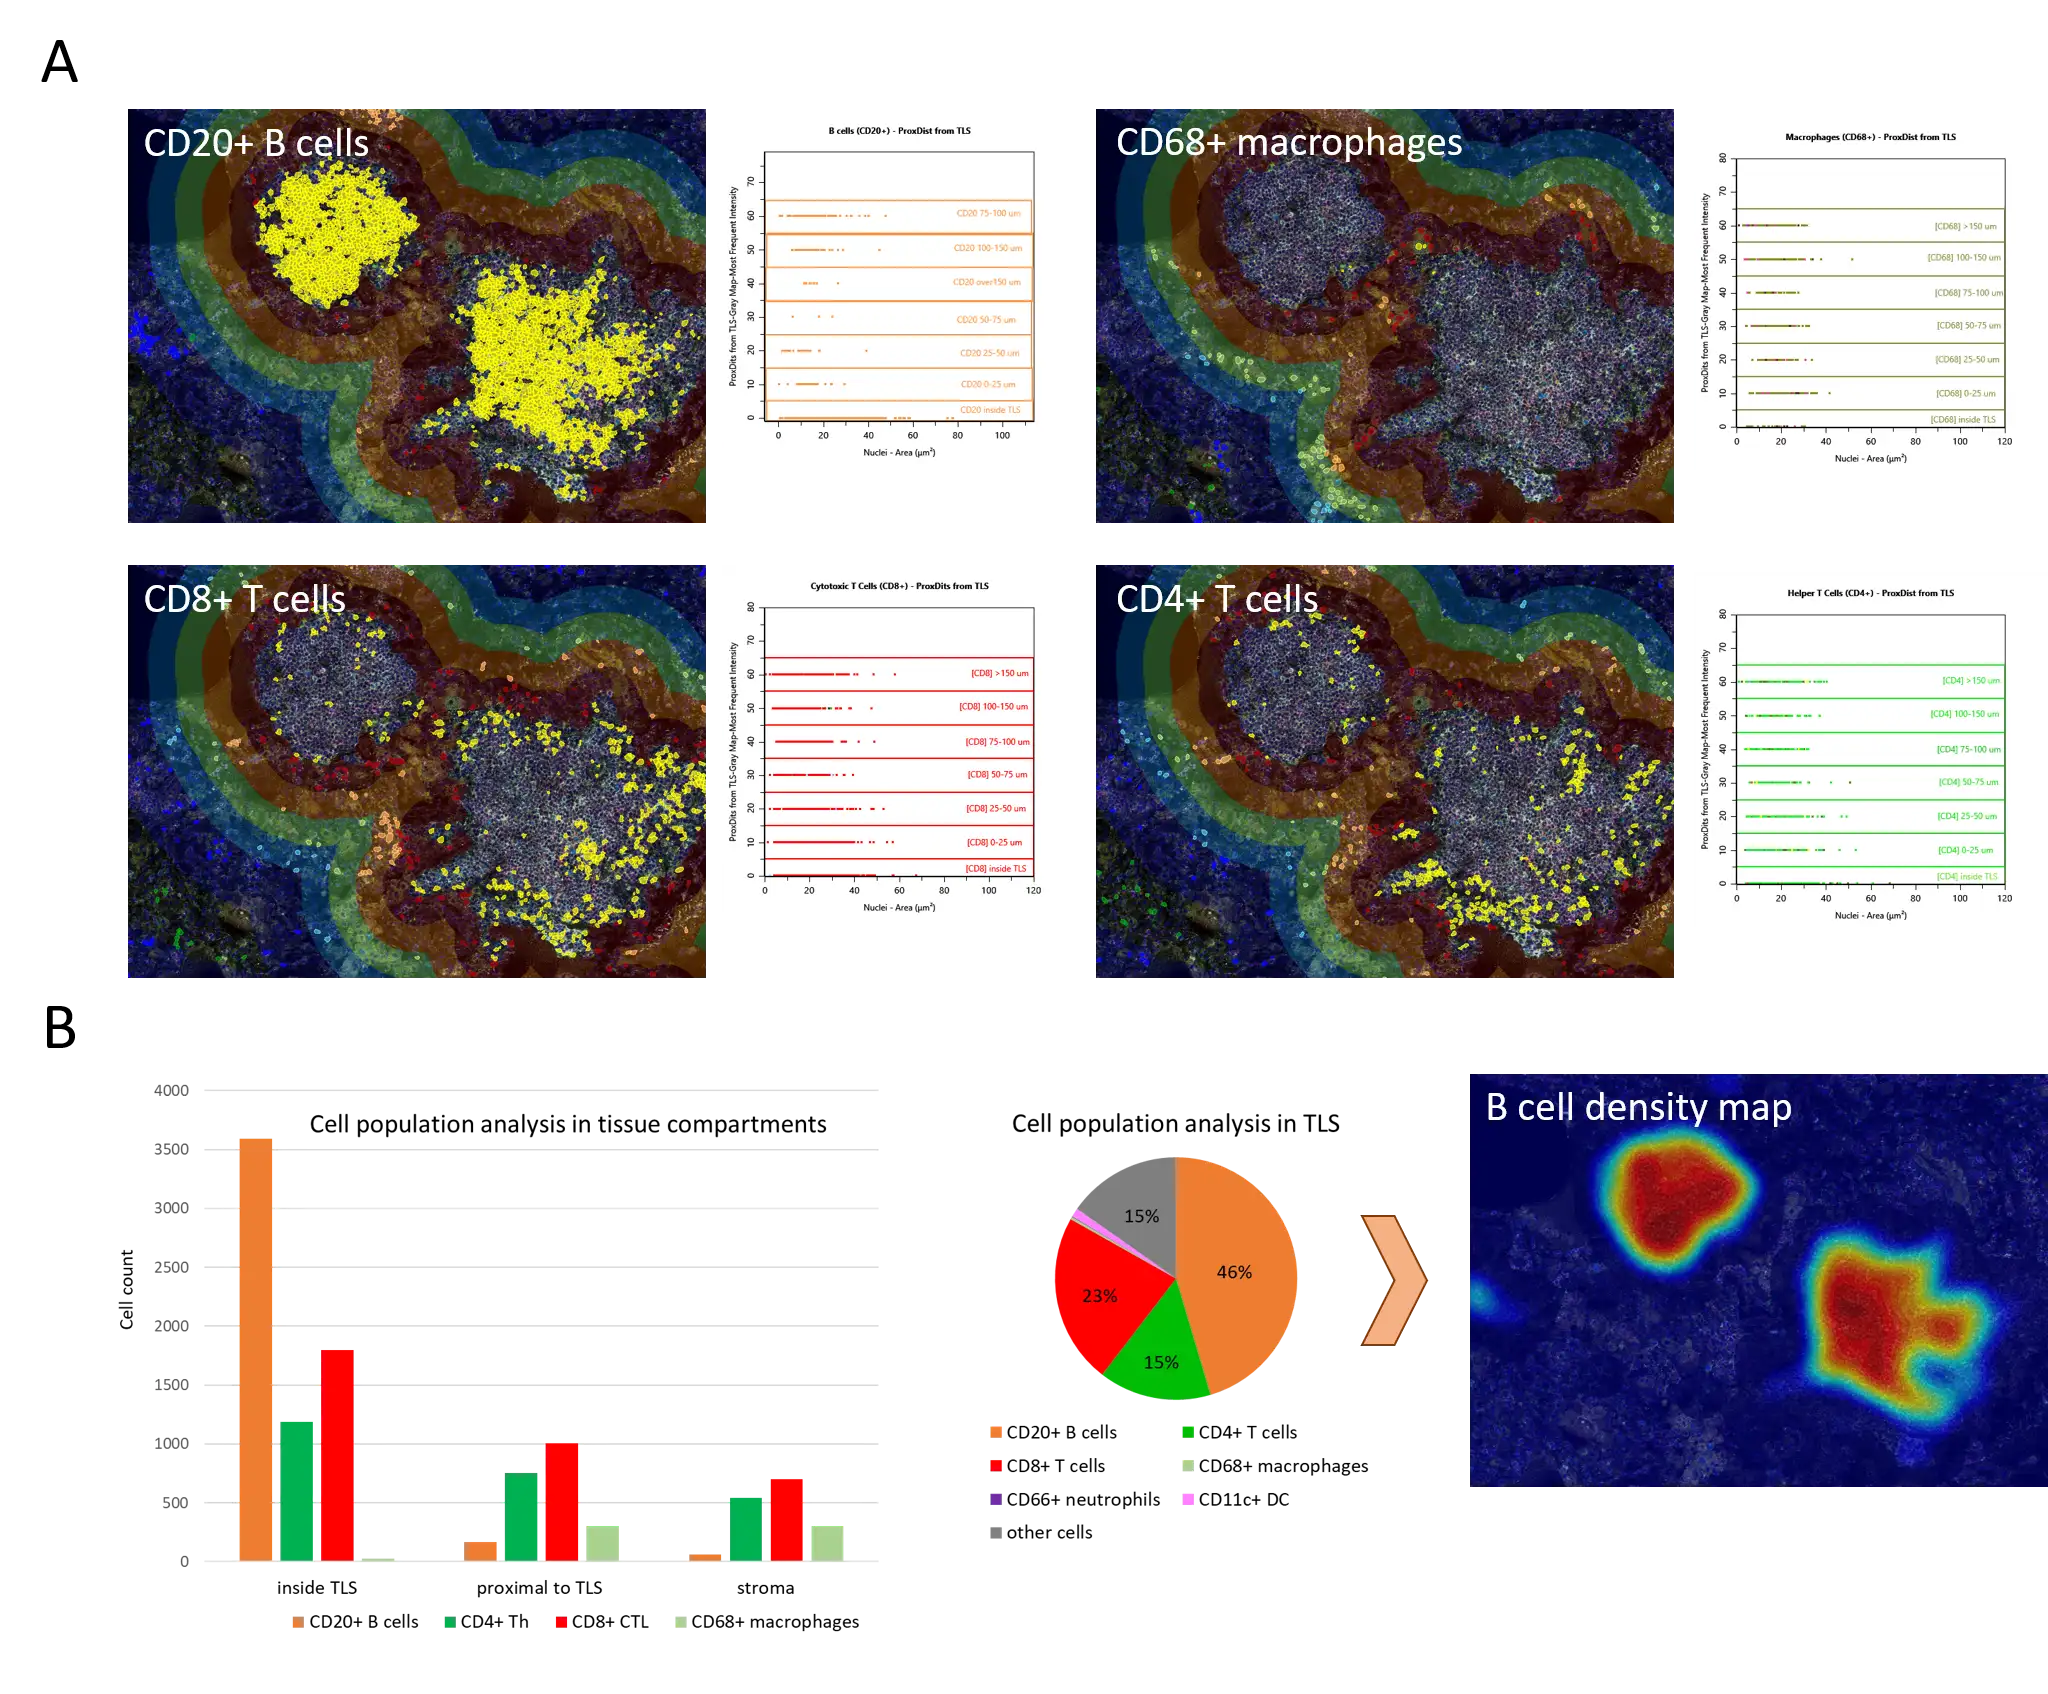
Figure 3. (A) Spatial distribution of B cells, Th and CTLs in and outside TLS. (B) Immune cell population analysis in tissue compartments (inside TLS, up to 100 µm from TLS and over 100 µm from TLS). High B cell density marks TLS as B cell hot spots.
Activation status of immune cell populations as well as their composition in TLS has been shown to be reflected in their maturation stage, and mature TLS were linked to enhanced immune activity in several cancers (Peyraud et al, 2025). Here, we investigated the activation status of B and T cells via CD44 expression (Figure 4) and found that (i) expression intensity of CD44 did not significantly vary among the lymphocyte populations and (ii) around half of lymphocytes expressed the activation marker, indicating their possibly stronger anti-tumoral potential.
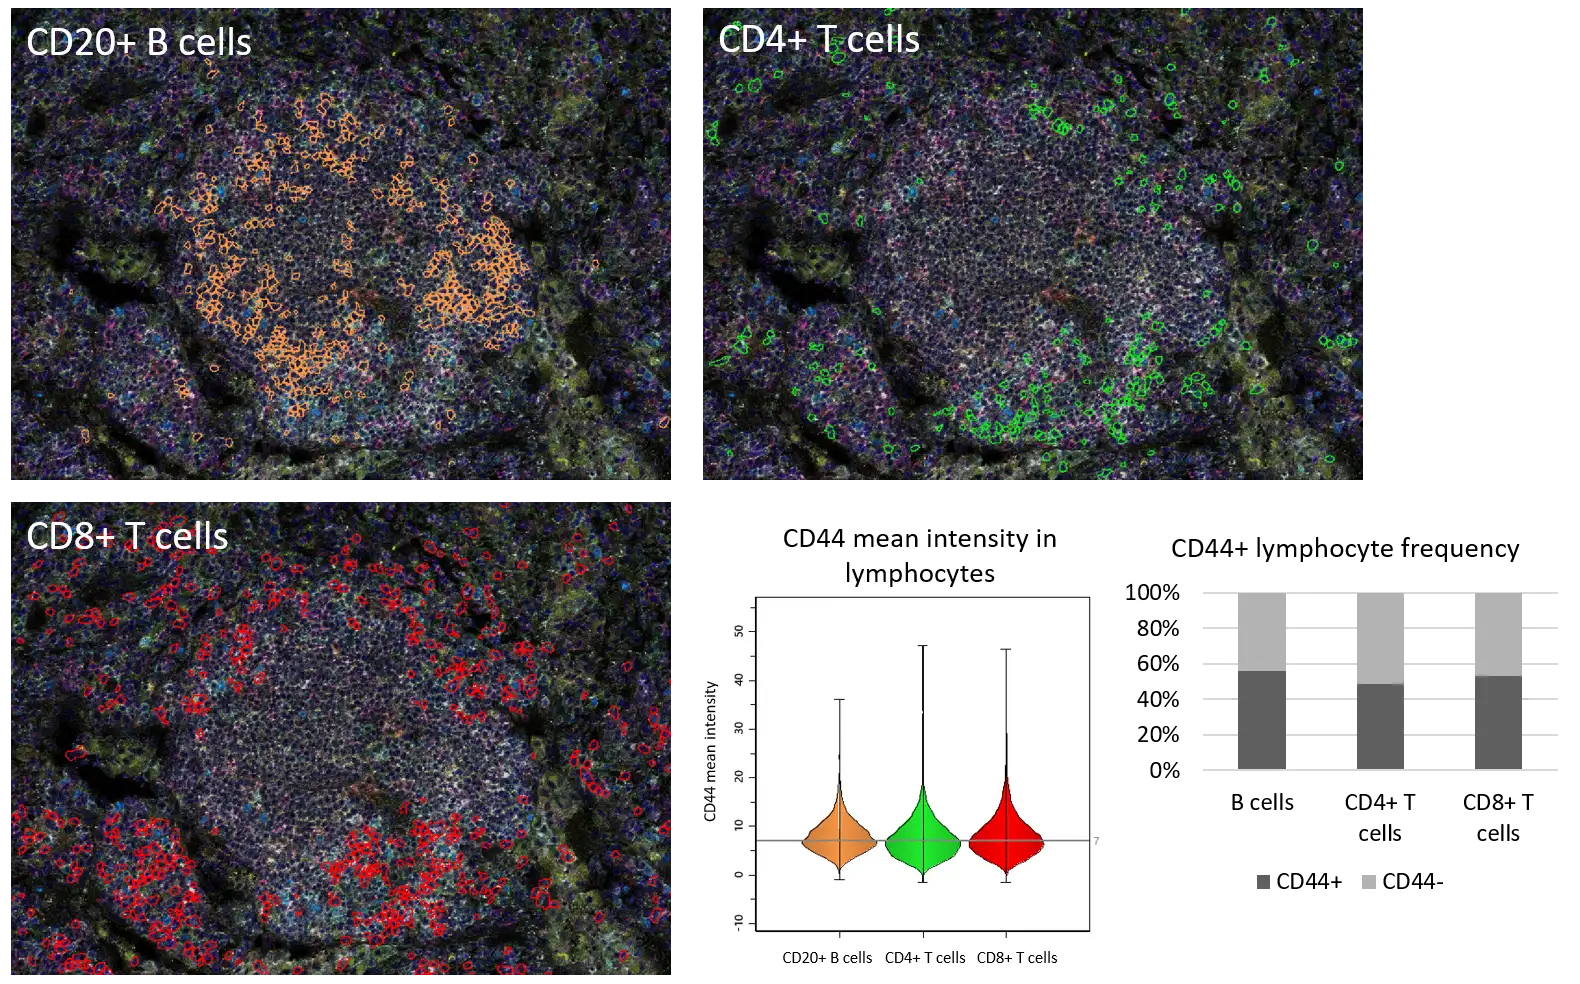
Figure 4. Distribution of CD44+ B cells, T helper cells and CTLs in TLS.
Although myeloid cells constitute a small percentage of cells inside TLS, they are still able to shape the surrounding tumor microenvironment (TME). Particularly, macrophages are known to either suppress or promote tumor progression, depending on their phenotype and surrounding cues (Niu et al, 2024). Neutrophils, most abundant circulating leukocytes, however, are effectively a “dark horse” and extensive research is required to elucidate their role in the TME (Sun et al, 2026).
Using in-built Phenotype Interaction engine, we analyzed spatially co-enriched cell types, focusing on macrophage-lymphocyte and neutrophil-lymphocyte interactions (including B cells, Th and CTLs). In this instance, interaction is based on the proximity of two selected phenotypes in the radius of 20 µm.
Our spatial analysis showed that, with correction for cell abundance, macrophages displayed preferred proximity to all selected lymphocyte types, including B cells concentrated within lymphoid structures, whereas neutrophils preferentially associate with T cells and show little enrichment near B-cell-rich structures. Both macrophages and neutrophils had the highest number of interactions (over 10) with CD8+ T cells. This may indicate unique potential of myeloid cells, particularly neutrophils, in shaping CTL-mediated responses.
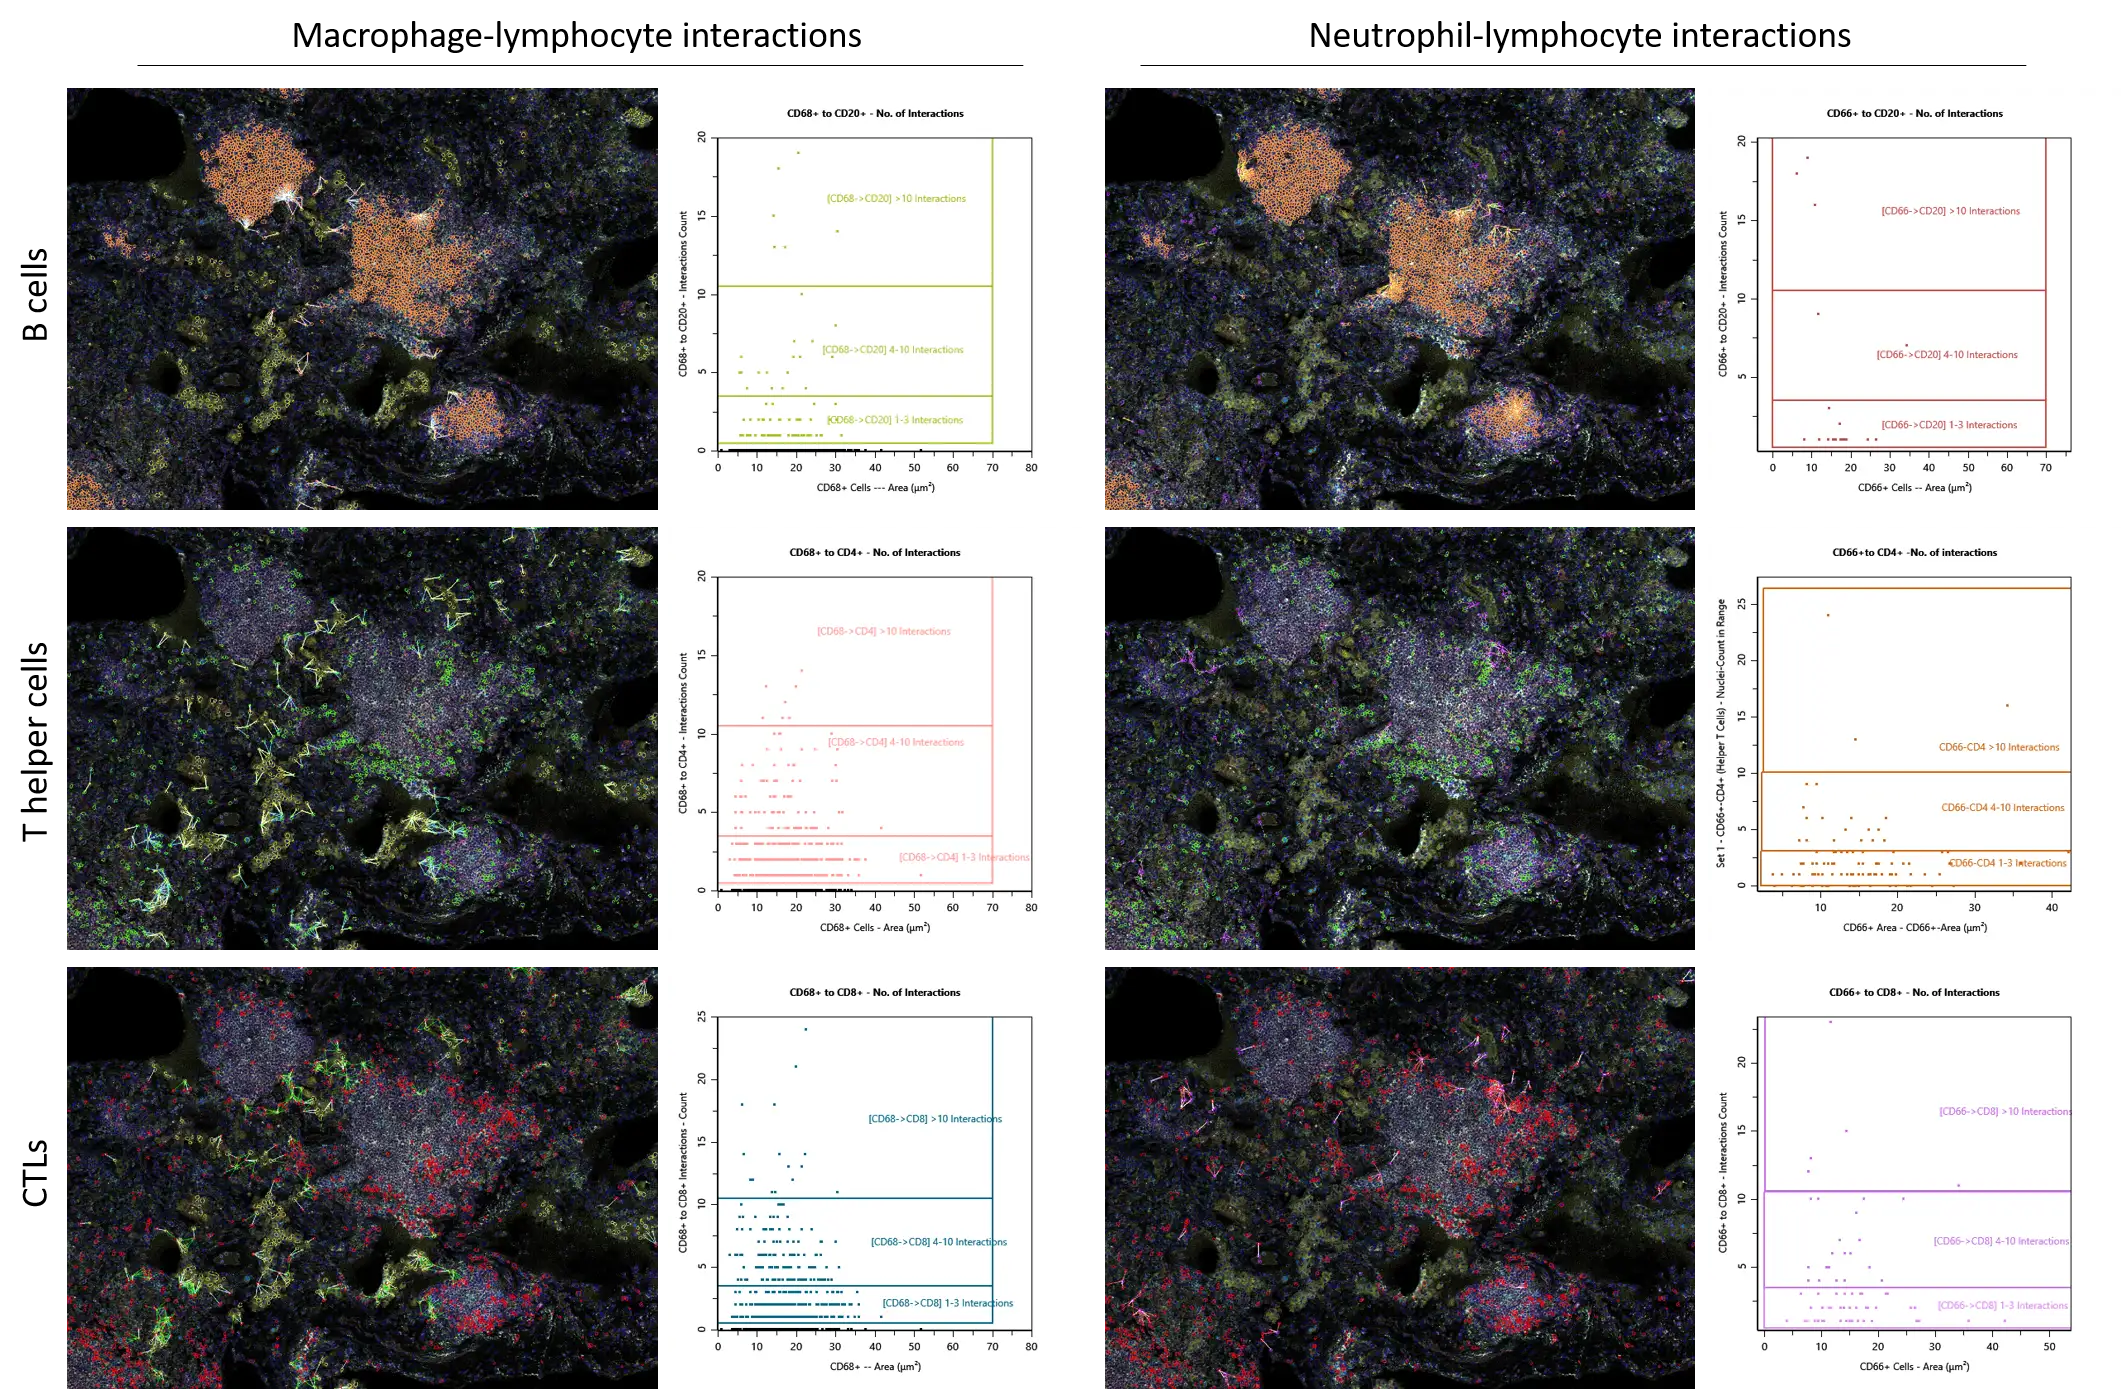 Figure 5. Spatial co-enrichment analysis of macrophage- and neutrophil-lymphocyte interactions.
Finally, we assessed the projected distribution of immune cell populations using 2D and 3D manifold learning techniques available in StrataQuest (t-SNE, UMAP, PCA, SONG). B cells, while segregated from T cells, often occupy same clusters due to the nature of TLS composition. Myeloid cells are mostly found in CD45+ clusters separate from TLS-associated lymphocytes. CD31+ endothelial cells cluster with non-immune cell populations. To conclude, manifold learning plots can be a useful tool for investigating cell populations from complex, high-dimensional data.
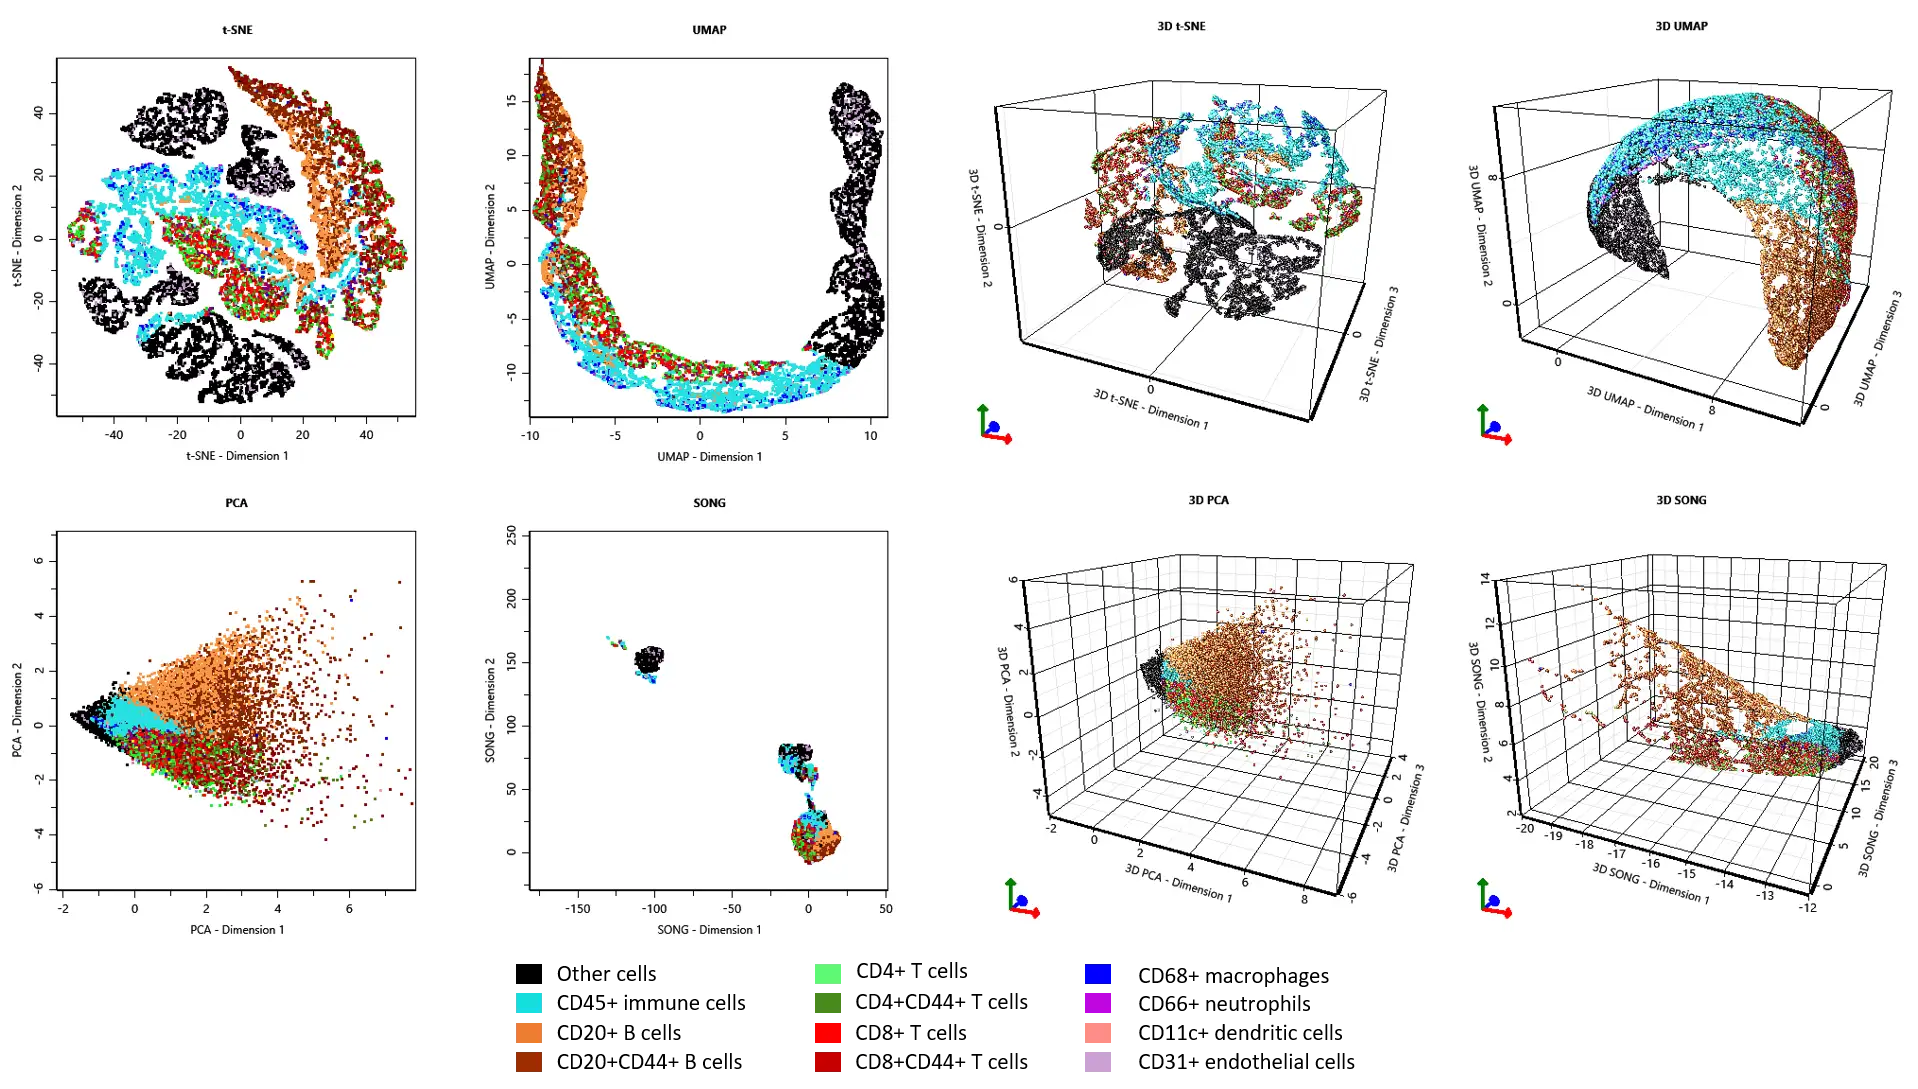
Figure 6. 2D and 3D manifold learning plots help analyse multi-parametric data.
While high-plex imaging technologies such as IMC can help researchers interrogate the tumor microenvironment, it may prove difficult to find meaningful insights in the sheer volume of generated data. StrataQuest streamlines the analysis workflow from cell segmentation to cell phenotyping and advanced spatial analyses. Find out how StrataQuest can power your spatial proteomics data analysis pipeline and contact our team for a personalized demo.
Sources:
1. Stringer, C., Wang, T., Michaelos, M. et al. Cellpose: a generalist algorithm for cellular segmentation. Nat Methods 18, 100–106 (2021). https://doi.org/10.1038/s41592-020-01018-x
2. Peyraud F, Guegan JP, Vanhersecke L, Brunet M, Teyssonneau D, Palmieri LJ, Bessede A, Italiano A. Tertiary lymphoid structures and cancer immunotherapy: From bench to bedside. Med. 2025 Jan 10;6(1):100546. doi: 10.1016/j.medj.2024.10.023. PMID: 39798544.
3. Li Niu, Ting Chen, Aodan Yang, Xiwen Yan, Feng Jin, Ang Zheng, Xinyue Song. Macrophages and tertiary lymphoid structures as indicators of prognosis and therapeutic response in cancer patients. Biochimica et Biophysica Acta (BBA) - Reviews on Cancer. Volume 1879, Issue 5, 2024. https://doi.org/10.1016/j.bbcan.2024.189125.
4. Jun Sun, Fan Yang, Yinyan Li, Shenglong Li, Jianbo Song. Neutrophil polarization landscapes in HCC: From immunosuppressive niches to antitumor immunity resuscitation. Cancer Letters, Volume 651, 2026. https://doi.org/10.1016/j.canlet.2026.218527.
