

High-content quantitative phenotyping with 30 markers using Imaging Mass Cytometry
StrataQuest enables high-content image analysis of IMC datasets. This case study demonstrates single-cell and proximity measurements across 30 markers within one tissue section for comprehensive spatial phenotyping.
single-cell analysis
spatial analysis
multiplex IF
imaging mass cytometry
Application Note

High-content quantitative phenotyping with 30 markers using Imaging Mass Cytometry
04 Oct, 2022
TissueGnostics contextual image analysis software StrataQuest enables the quantitative analysis of high-content high-plex tissue images. Such datasets are increasingly generated by advanced multiplexed imaging approaches, including Imaging Mass Cytometry (IMC), which combines antibody-based labeling with mass spectrometry to simultaneously detect dozens of biomarkers within a single tissue section.
While these technologies provide rich, spatially resolved information, they also introduce analytical complexity due to the high dimensionality and size of the data. StrataQuest addresses this by supporting automated image processing workflows that preserve tissue context while enabling scalable, reproducible analysis across many markers.
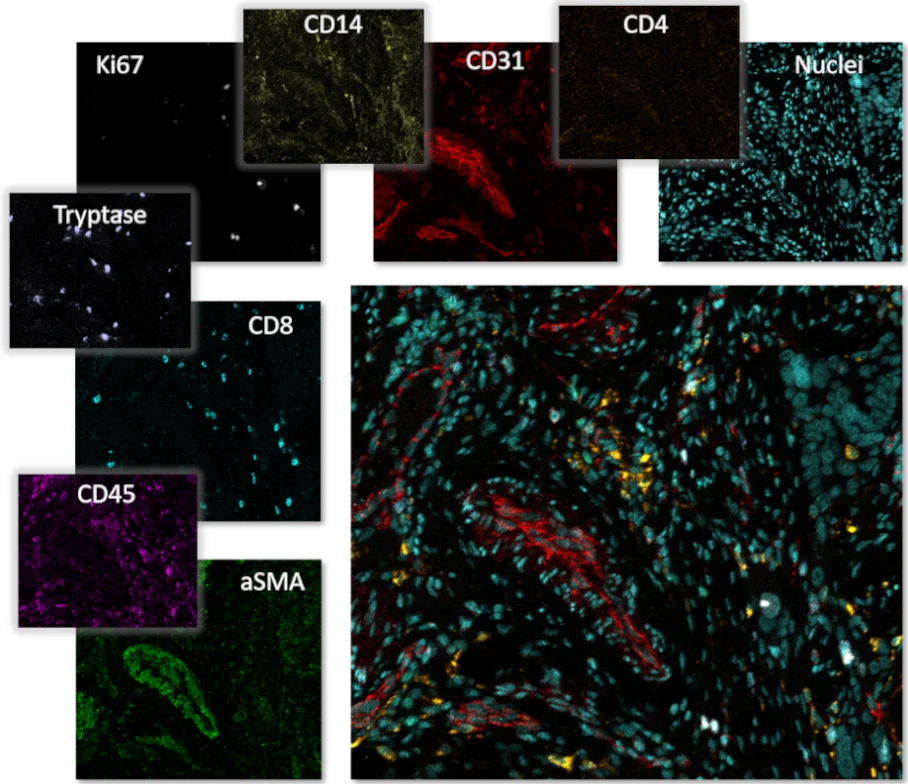
In the example presented here, a 30-marker panel was analyzed within a single tissue section. The workflow included automated detection of nuclei, classification of marker-positive cells, and quantification of their spatial relationships within the tissue microenvironment. Representative markers include DNA (nuclei), CD4 (helper T cells), CD31 (vascular endothelium), CD14 (monocytes/macrophages), Ki67 (proliferation), Tryptase (mast cells), CD8 (cytotoxic T cells), CD45 (pan-leukocyte marker), and αSMA (myofibroblasts).
The primary objective was to accurately identify and quantify distinct cell populations and to assess their spatial distribution - specifically, measuring distances between marker-positive nuclei and blood vessels which enables deeper insights into tissue organization and cellular interactions.
Image courtesy: Dr. Akhila Balachander, Spatial ImmunoPhenomics Platform, Singapore Immunology Network, SIGNAL grant.
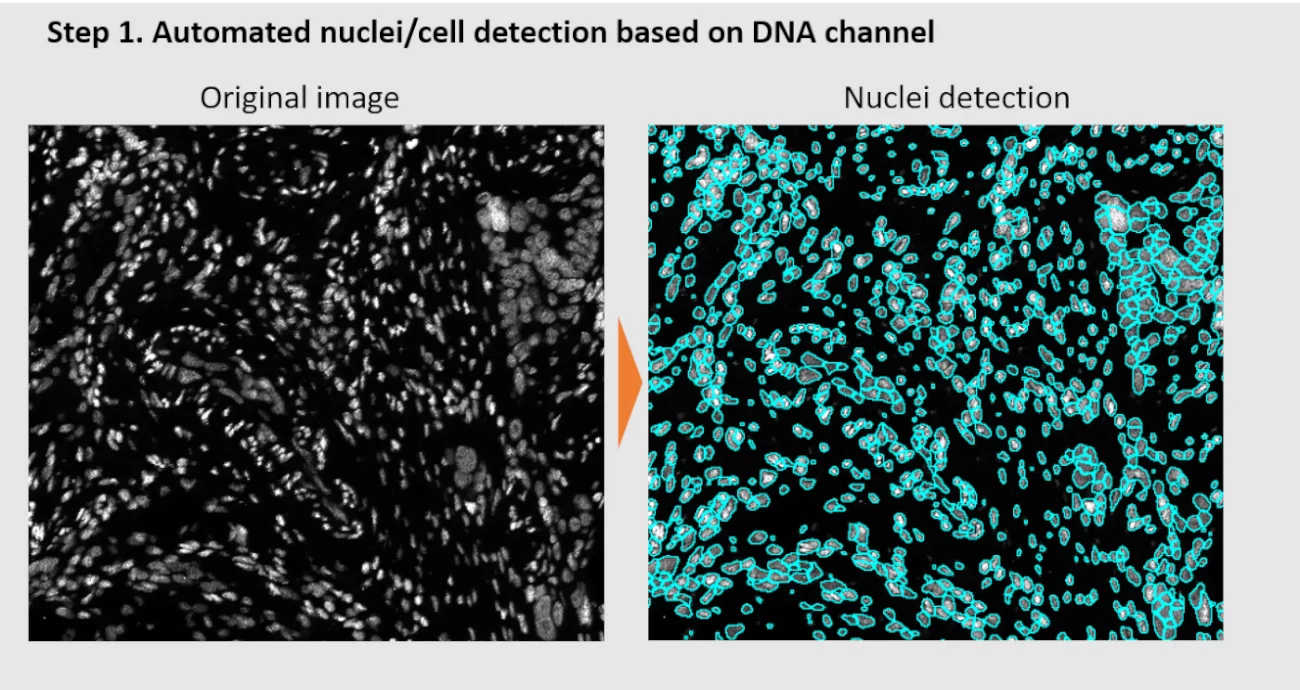
Step 1: Nuclei segmentation. The nuclei are automatically detected based on DNA channel, as it is represented in the right image where the nuclei are outlined in turquoise. It's possible to choose from classical thresholding or machine-learning method, depending on the density of cells in the tissue.
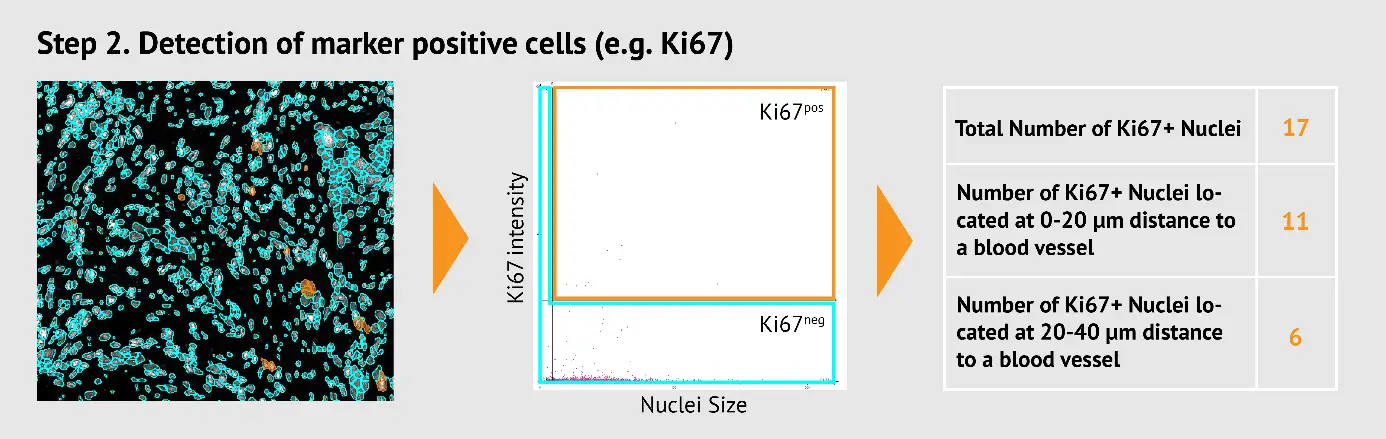
Step 2: Identification of marker-positive cells (in this example, Ki67, shown in orange). To gain quantitative information, scattergrams are used with cut-offs separating Ki67-positive (1.36%) from Ki67-negative cells. Gates can be set to select any population of interest, similar to flow cytometry, and establish a suitable gating strategy which can be controlled by immediate feedback on the image.
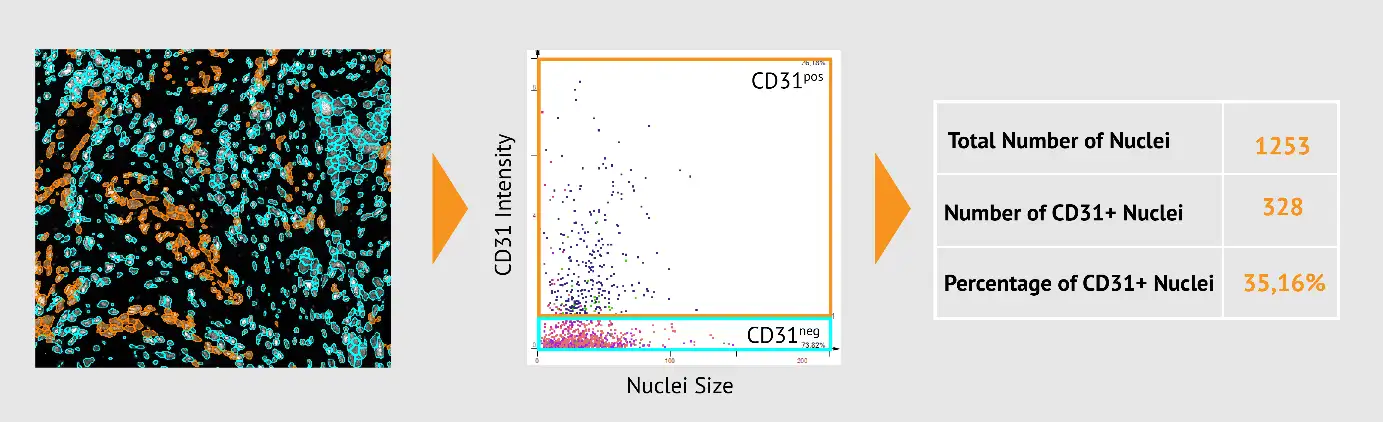
The same workflow can be applied to any marker of interest: for example, CD31.
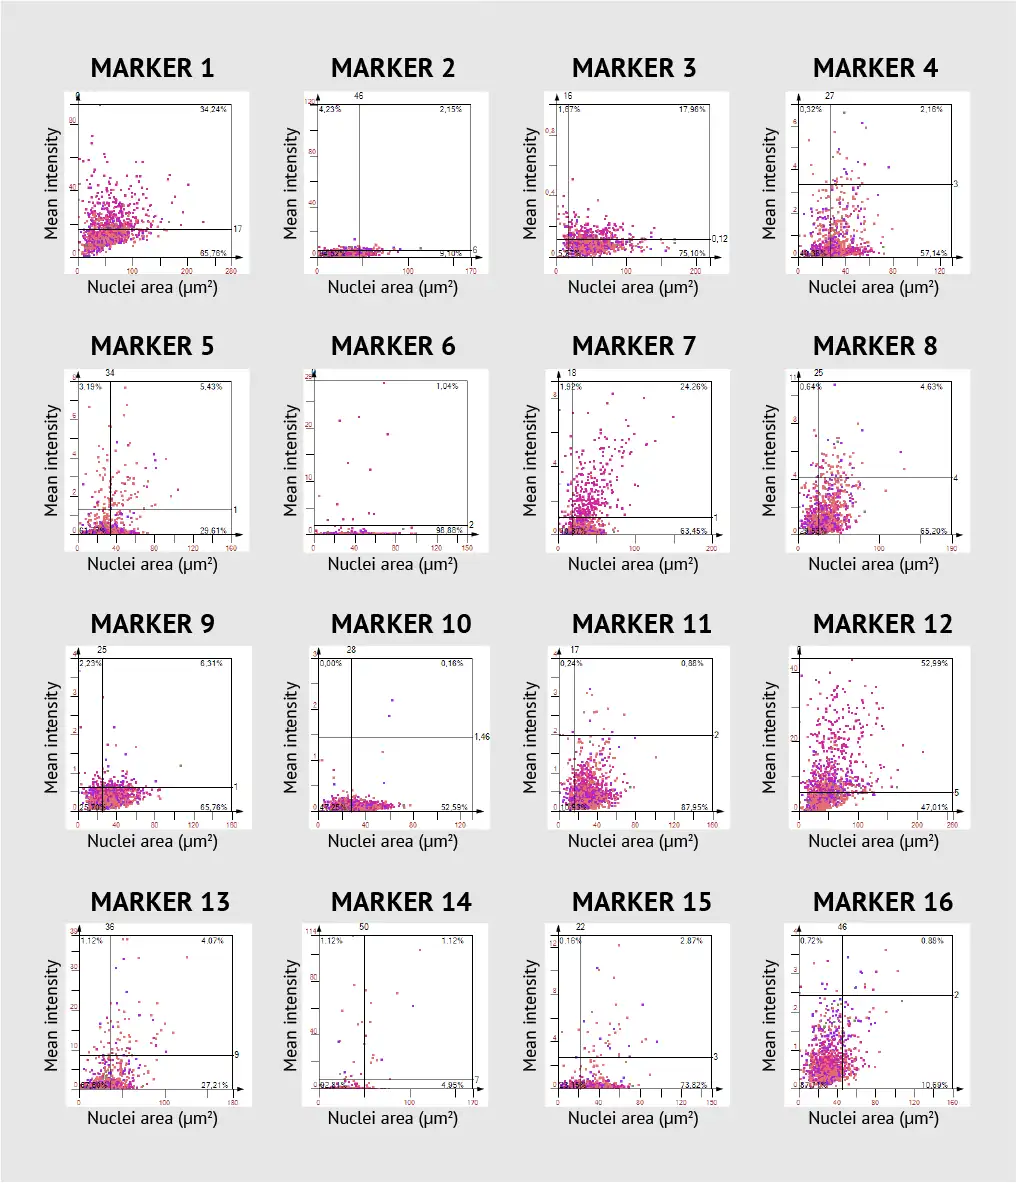
Scattergrams can be generated for any marker, offering a wide panel of data to choose from. The panel below represents scattergrams for 16 different markers at once, where individual marker mean intensity is plotted against corresponding nuclei size. This way, StrataQuest offers a good overview of the whole data set with adjustable parameters.
Step 3: Spatial analysis. To quantify spatial relationships within the tissue, distances between marker-positive nuclei and the nearest blood vessels are calculated and grouped into user-defined ranges (e.g., 0–20 µm, 20–40 µm). These distance intervals can be easily adjusted to suit different biological questions or tissue scales.
First, a proximity map is generated based on the distance to the nearest vessel. This is visualized as a heatmap, where vessels are indicated in blue and increasing distance is represented by progressively warmer colors.
Next, the proximity map is combined with nuclei detection and marker classification results. This enables the identification and quantification of specific cell populations within defined spatial ranges. For example, proliferating Ki67-positive cells located within 0–20 µm of the nearest vessel can be selectively visualized (e.g., highlighted in orange) and quantitatively analyzed.

Supported by the streamlined workflow in StrataQuest, multiplexed imaging approaches such as Imaging Mass Cytometry can be combined with spatial distance analysis to address a wide range of biological questions about tissue organization, cellular interactions, and microenvironmental context.
To learn how TissueGnostics solutions can be integrated into your existing imaging workflows and tailored to your specific research needs, we invite you to get in touch with our team.
See also:
