Evaluating the Distance of Tumor Cells from Blood Vessels
The tumor vasculature is essential for keeping the tumor alive and facilitating its often-extensive growth. Tumor cells depend on the oxygen and nutrient supplies from the blood vessel and thus need to be at the closest distance to survive and proliferate (Forster et al, 2017). Tumor angiogenesis has been investigated for decades in search of the appropriate inhibitor agent, and this topic still offers a variety of open questions.
The following example regarding such a research question was analyzed using the IF Tumor Foci Angio App. The automated analysis workflow was established for the Johns Hopkins Hospital in New York. The aim of the project was to (i) assess the number of tumor and non-tumor nuclei, (ii) the number of blood vessels, and (iii) to evaluate the distance of tumor cells from blood vessels within the tumorous areas.
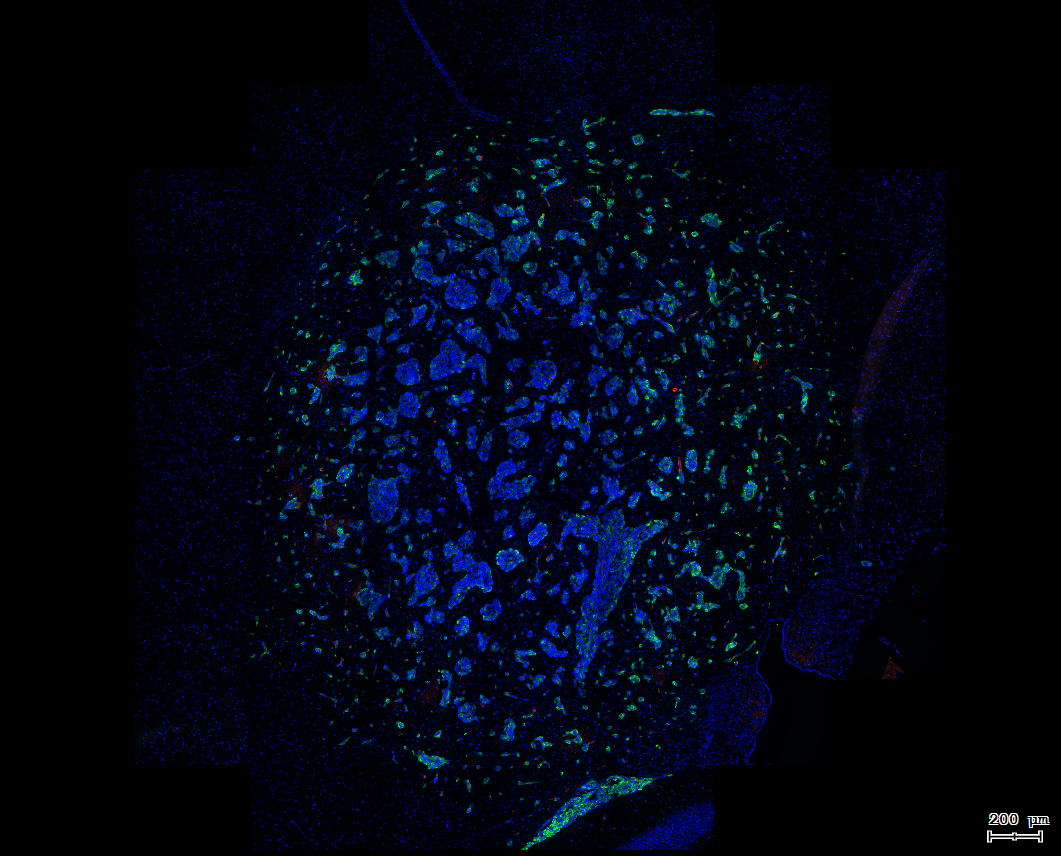
Brain tumor whole digital slide
The brain tumor tissues are stained by cytokeratin (green) to detect tumor areas, CD31 (red) to detect blood vessels, and DAPI (blue) as nuclei marker (a).
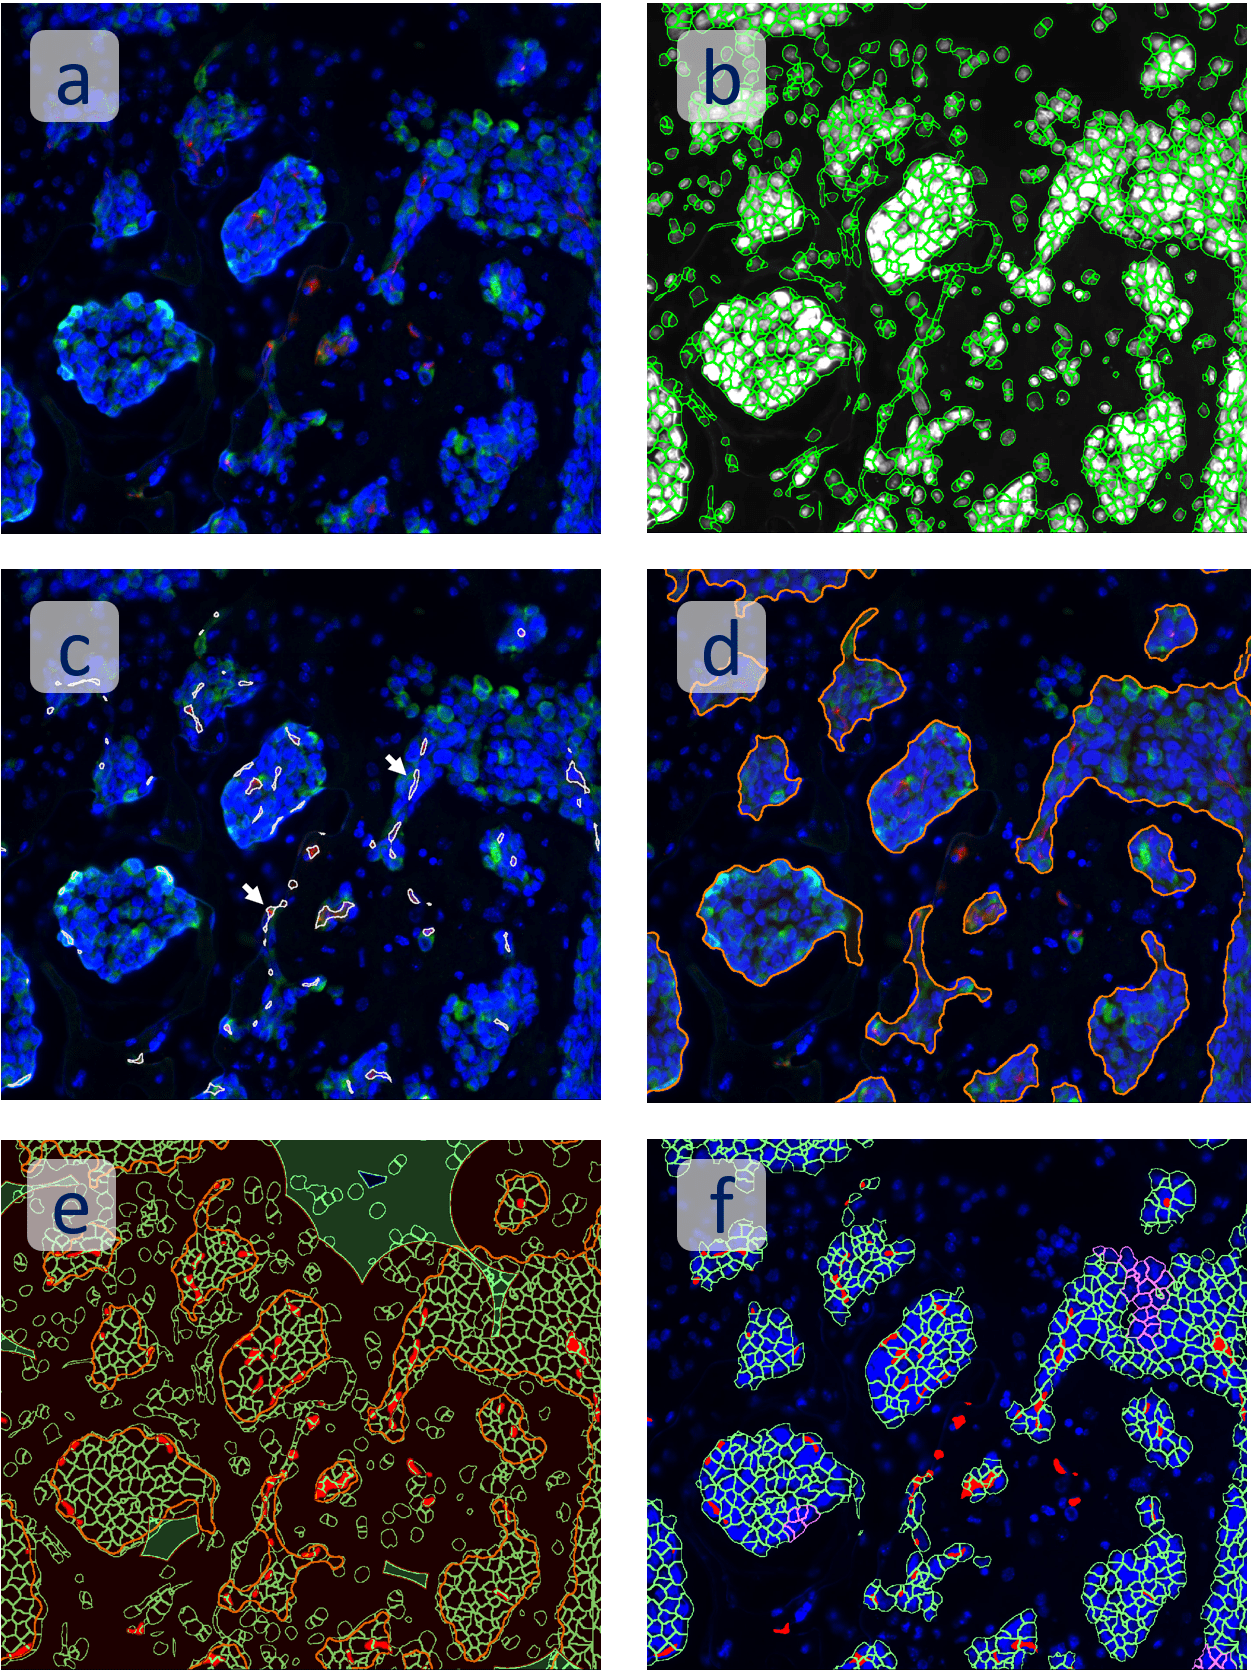
The basic workflow steps for the IF Tumor Foci Angio App are explained and shown below (figure c-f). First, nuclei are detected based on the DAPI staining (b), showing the segmented nuclei marked by the green outline over a grayscale image.
Next, the two key morphological substructures, (c) blood vessels detected by staining intensity of CD31 (arrows indicate small vessels in white outline), and (d) tumor regions detected by cytokeratin staining and high cell density (orange outline), were detected.
To evaluate the distances from tumor cells to blood vessels, a proximity map based on distance from the nearest blood vessel (in red) is used (e). It further allows the user to define distance ranges. (f) The tumor nuclei in 0-50µm range from the closest vessel are shown in green, and in 50-100µm range in pink.
The results of this analysis can be presented in flow cytometry-like scattergrams and histograms and may further be exported as numerical data in common CSV or Excel formats.
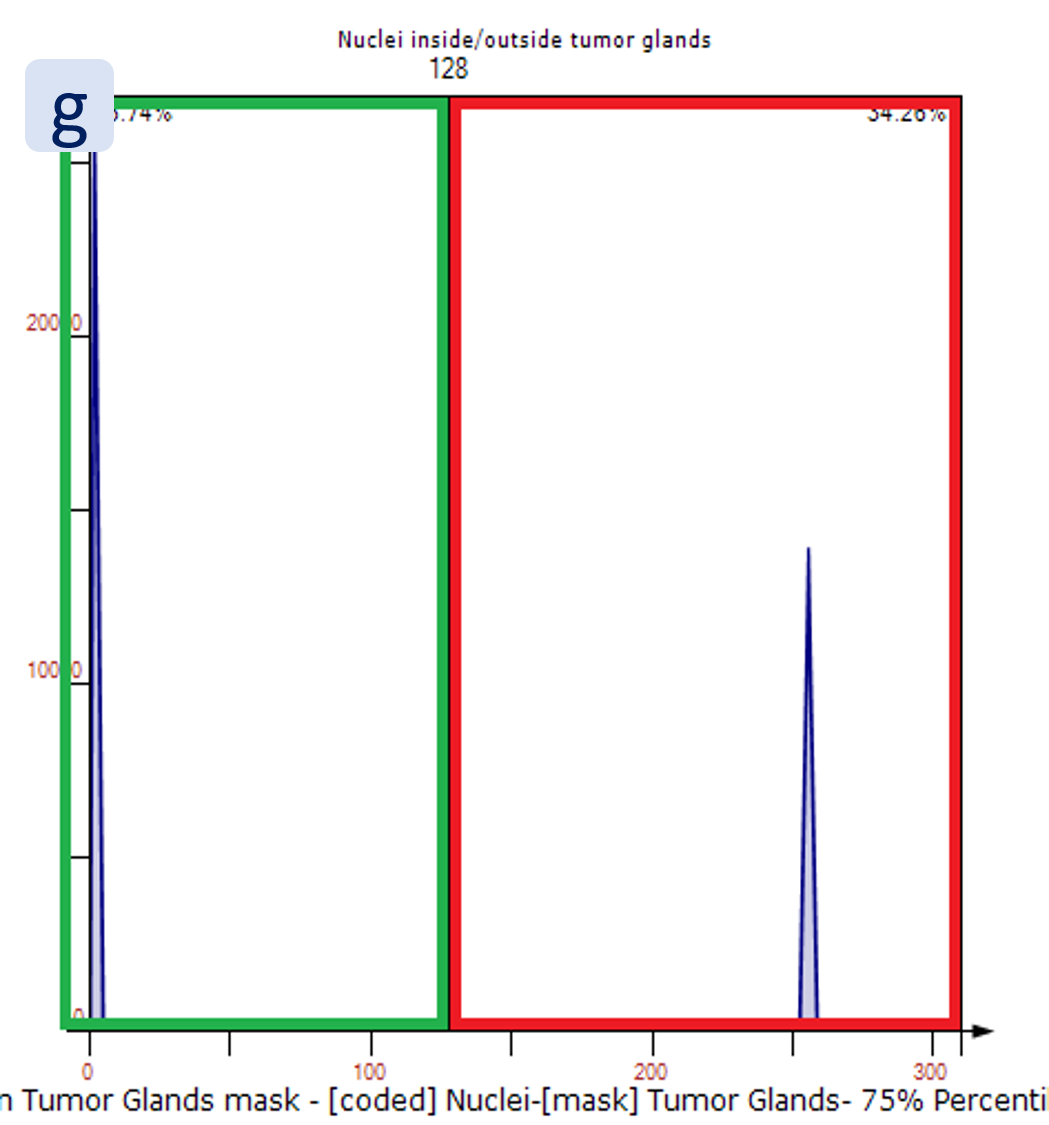
(g) is showing the number of detected tumorous nuclei (n = 13,379) and non-tumorous nuclei (25,551) within the entire tissue sample.
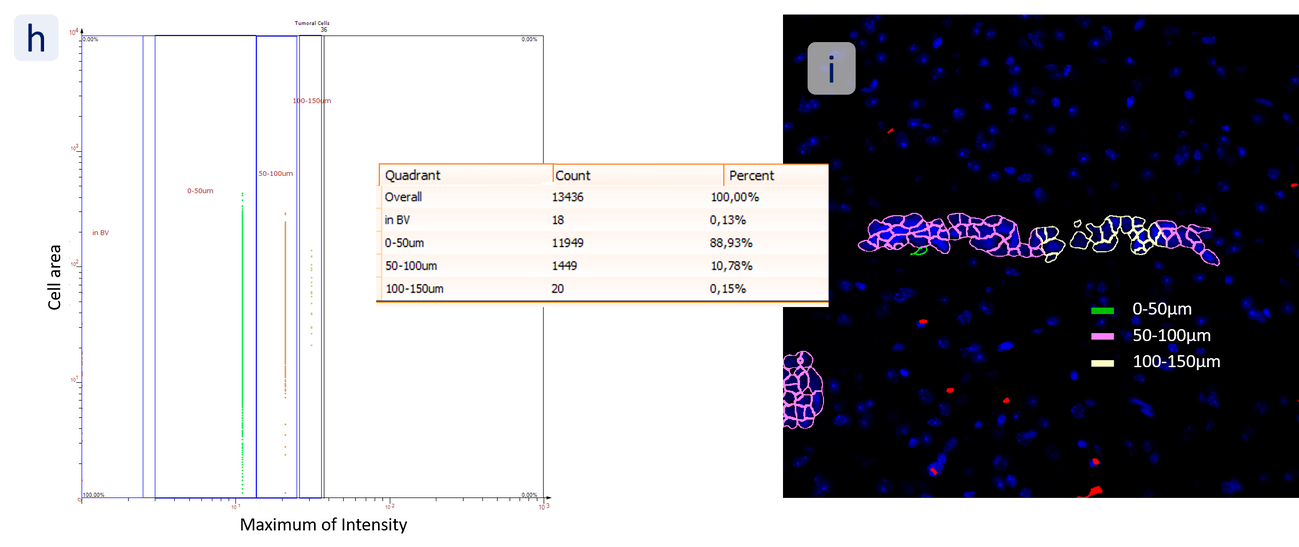
For this tissue sample (i), the number of detected tumor cells within each distance range of a blood vessel is as follows: 0-50 μm: 11 857/89%; 50-100 μm: 1 511/11%, only 20 cells in 100-150µm distance, as seen from the scattergram (h).
If you are interested in performing distance measurements or spatial analysis on digital slides, also take a look at our other case studies using the following features:
- Spatial Analysis of CD4+ Cells in Colorectal Cancer;
- TMA analysis with StrataQuest;
- Spectral Imaging and Spatial Analysis of TMA Samples.
Experts at TissueGnostics are committed to developing client-focused analysis solutions for every tissue cytometry-related research question (StrataQuest Apps) while prioritizing the accuracy and reproducibility of data from complex characterization studies. Reach out to a member of the TissueGnostics team today for a demonstration.