Full 1
SCANNING SOLutions
TissueFAXS Imaging Software
Full 1

TissueFAXS Imaging Software
Walk-away automation

TissueFAXS is TGs software for the control of the TissueFAXS and TissueFAXS i systems. It provides automated scanning capabilities, a state of the art sample viewer and management of the scan projects.

There are configurations of TissueFAXS for scanning slides, microtiter plates and high-throughput (Slide Loader, 120 slides).

TissueFAXS software is not available as a standalone version or for the control of other microscopes (upgrades of eligible microscopes to TissueFAXS or TissueFAXS S configuration excepted).

TissueFAXS Imaging Software
is integrated into all TG systems

  • TissueFAXS SL
  • TissueFAXS SL PLUS
  • TissueFAXS Spectra
  • TissueFAXS Q
  • TissueFAXS PLUS
  • TissueFAXS Fluo
  • TissueFAXS Histo
  • TissueFAXS i PLUS
  • TissueFAXS i Fluo
  • TissueFAXS i Histo


TissueFAXS Workflow and Automation

TissueFAXS workflow is based on a "preview scan - tissue or region detection - high magnification scan" approach. Once a solution has been established for a specific batch of slides a profile containing all essential information for scanning this batch of slides can immediately be saved and reused. The profile can very easily be adapted to divergences in the batch. 

Scan Flow Chart

TissueFAXS GUI

The TissueFAXS GUI is well organised with tabs and static windows.The Camera and Acquired Images tabs as well as the Preview window can be deployed to become discrete windows, with the camera window usually being deployed to the right screen in the two screen computer setups preferred by TG.

The image on the right shows the standard TissueFAXS GUI with the camera window integrated and visible as a tab behind the sample viewer.


TissueFAXS GUI

IF Dots App: Analysis of FISH

Fluorescence in situ hybridization (FISH) has been routinely used for decades in research and clinics to rapidly identify potential genetical changes within cells. This case study shows how TissueGnostics’ image analysis solution StrataQuest can be applied to evaluate FISH stainings.  The most streamlined solution, the IF Dots App (runs within StrataQuest), can be applied to any analysis of dot-sized objects within the nuclei. Depending on the research needs, the following analysis can be combined with any other kind of analysis including AI-based tissue classification, phenotyping, spatial analysis, etc.

The aim of the following case study was to (i) identify individual nuclei and (ii) to assess how many FISH dots per individual nuclei are present.

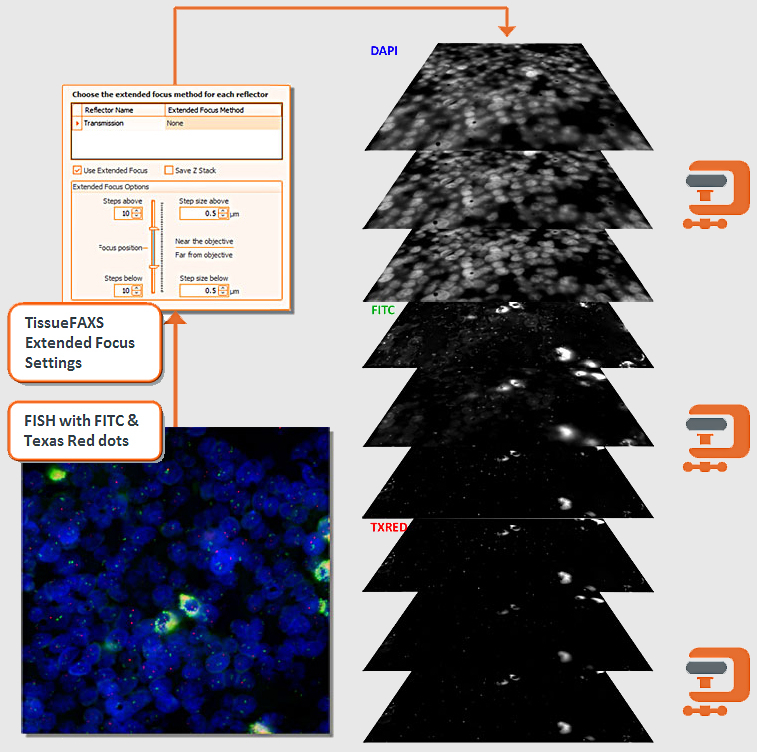
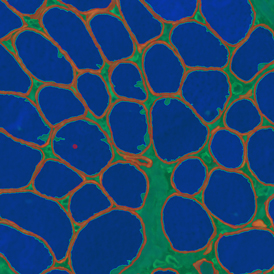
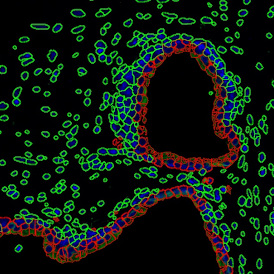
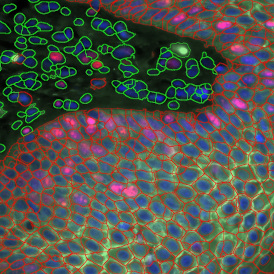
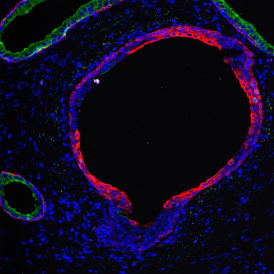
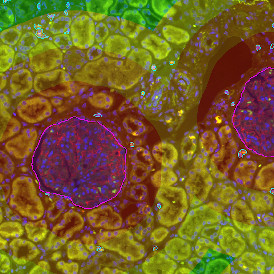
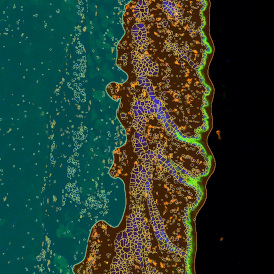
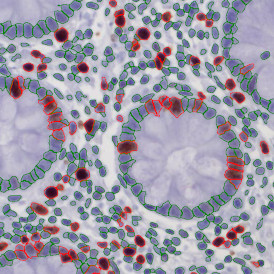
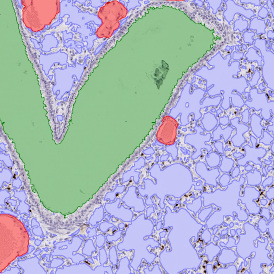
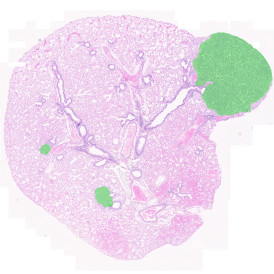
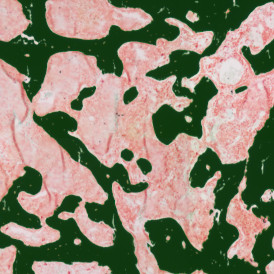
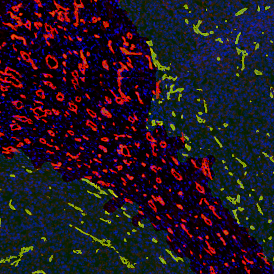
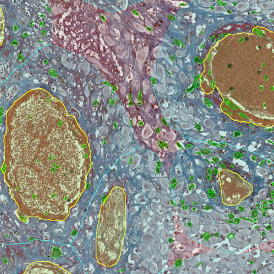
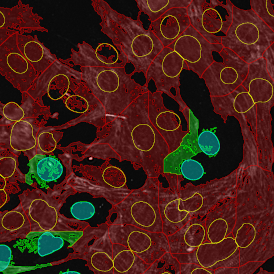
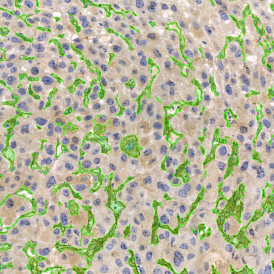
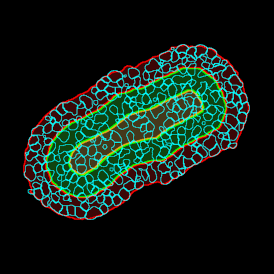
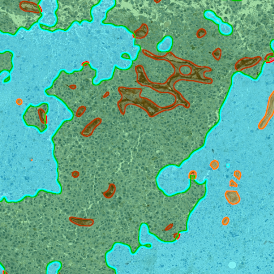
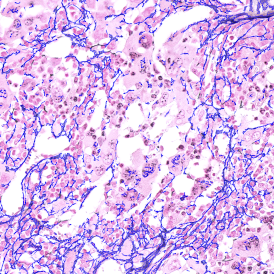
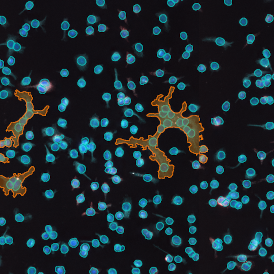
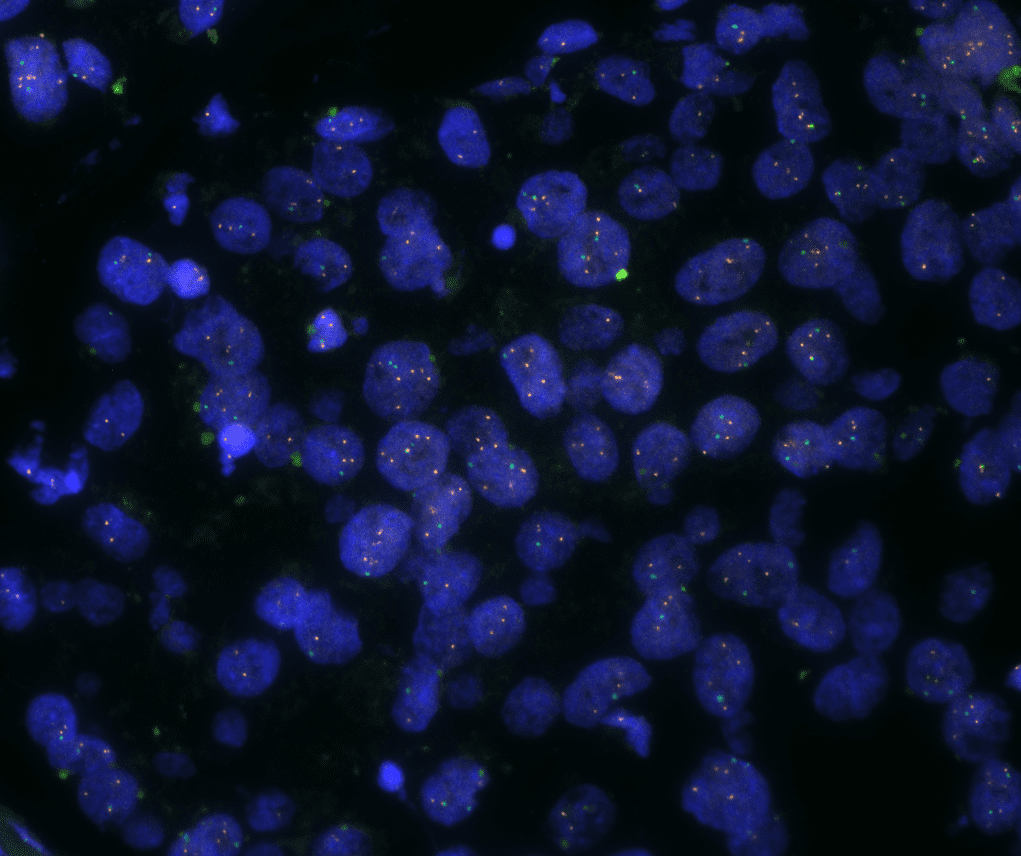
The image below shows an overview of a triple staining: the nucleus stained by DAPI (blue), and two FISH markers, the housekeeping gene (green), and HER2/neu (red).

IF Dots original 95

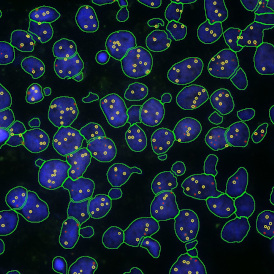
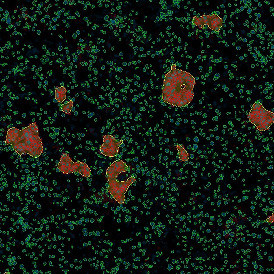
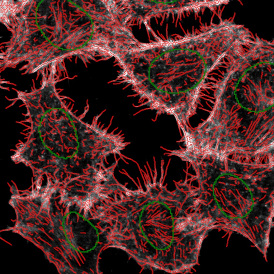
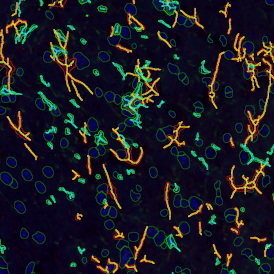
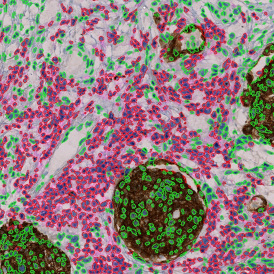
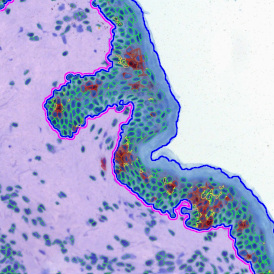
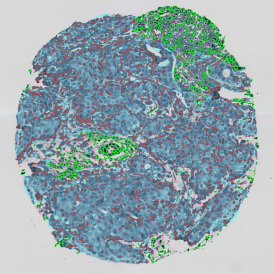
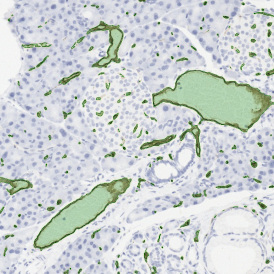
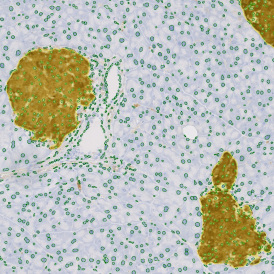
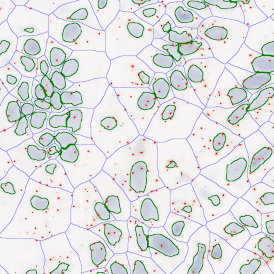
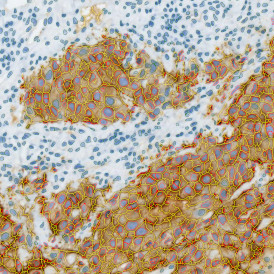
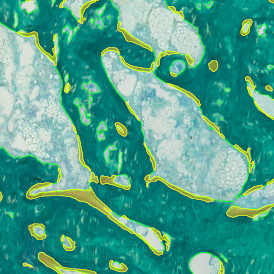
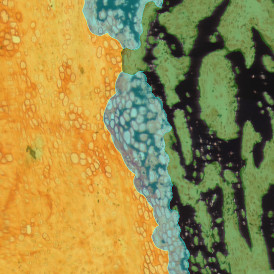
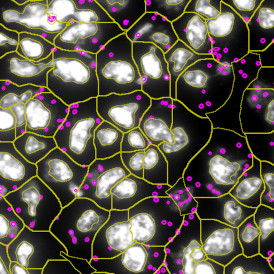
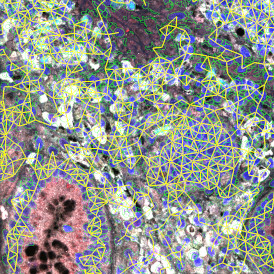
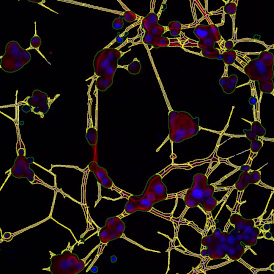
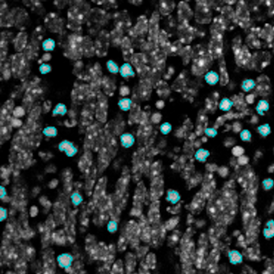
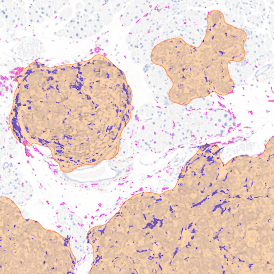
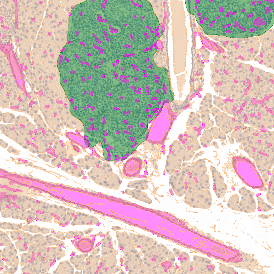
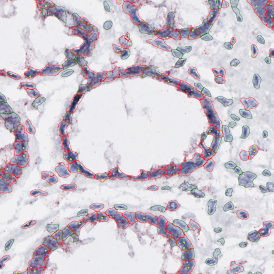
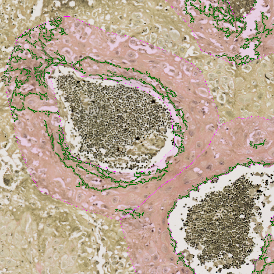
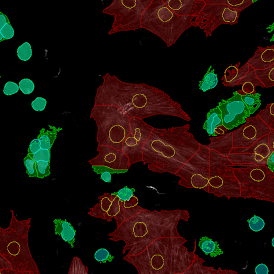
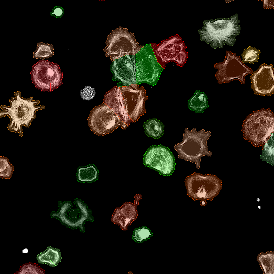
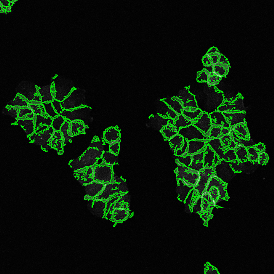
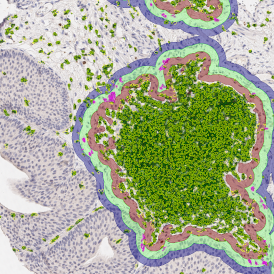
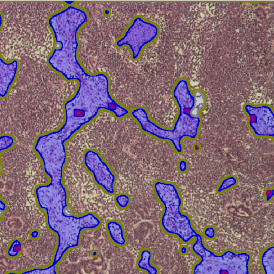
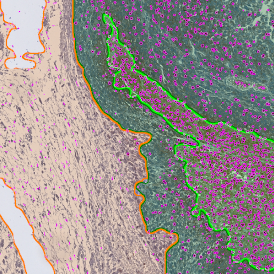
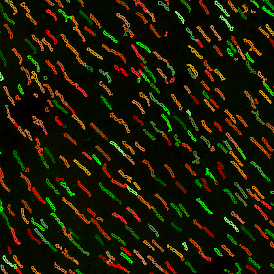
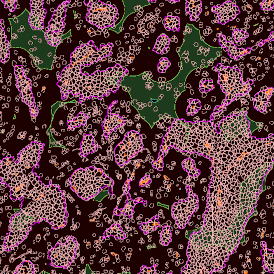
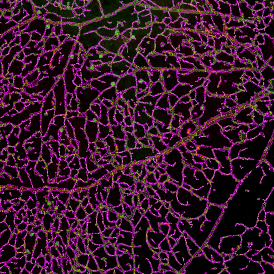
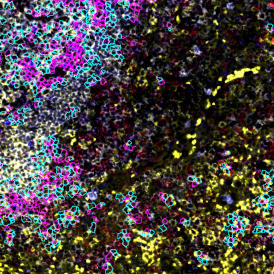
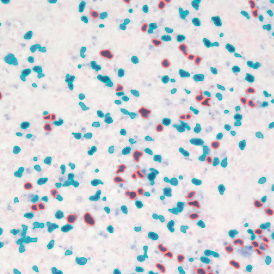
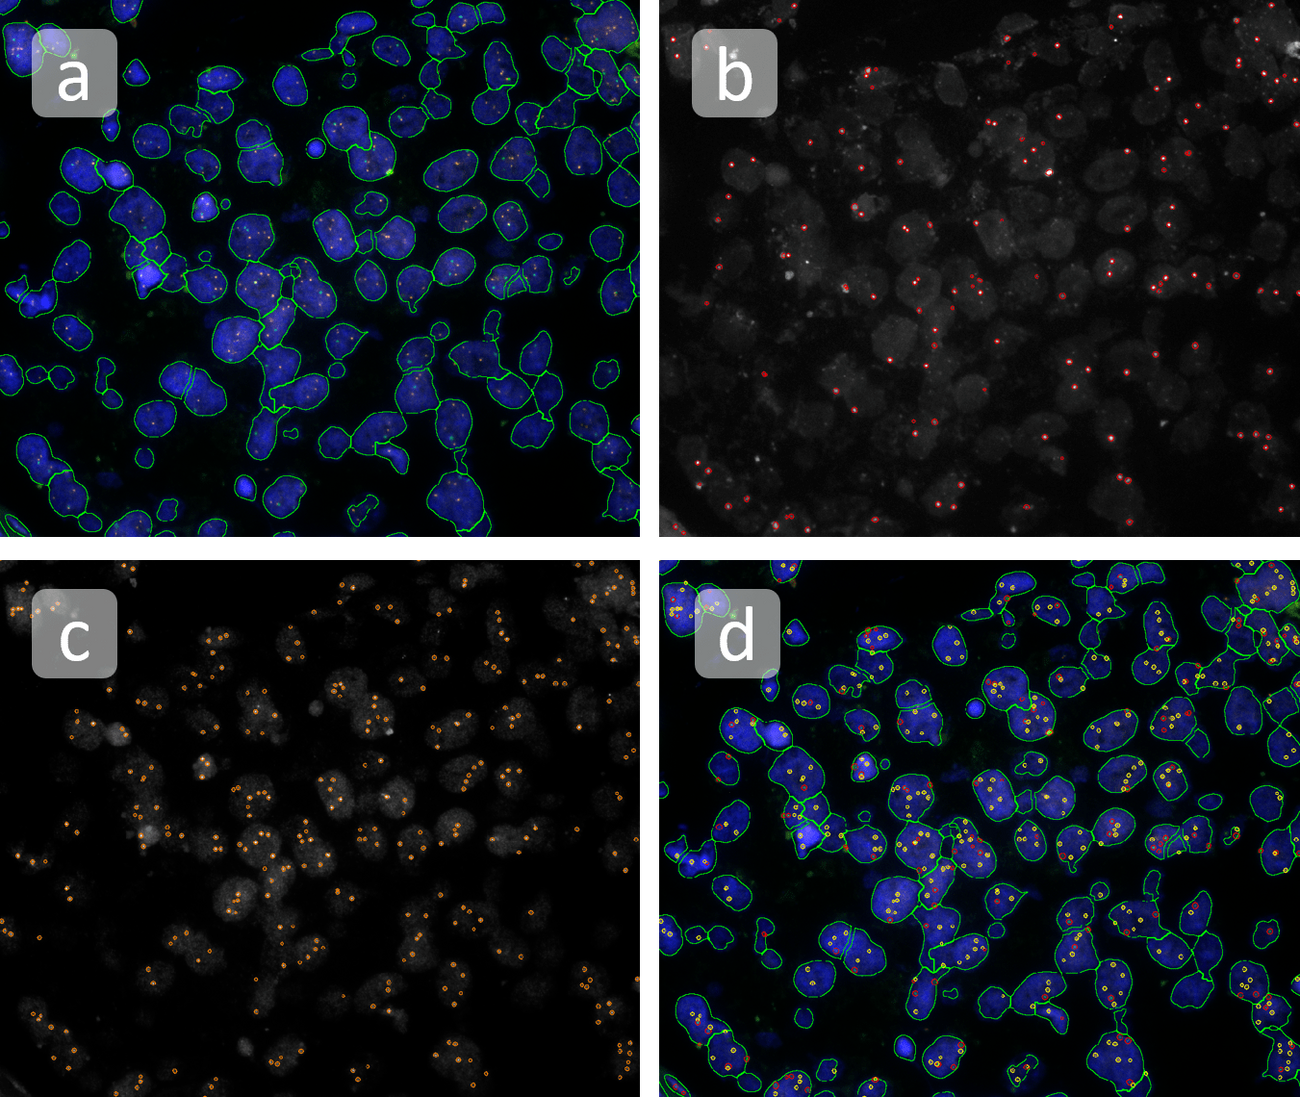
The automated analysis starts with nuclei segmentation (a), where nuclei are identified by the intensity of the DAPI staining (nuclei are marked by the green outline). In the next step, the FISH dots are detected: in red the housekeeping gene in FITC channel (b) and in yellow for the HER2/neu in Acridine channel (c). Then these masks can be combined, as seen in (d).


IF Dots min

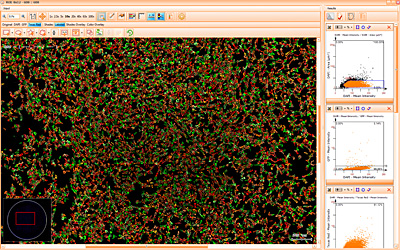
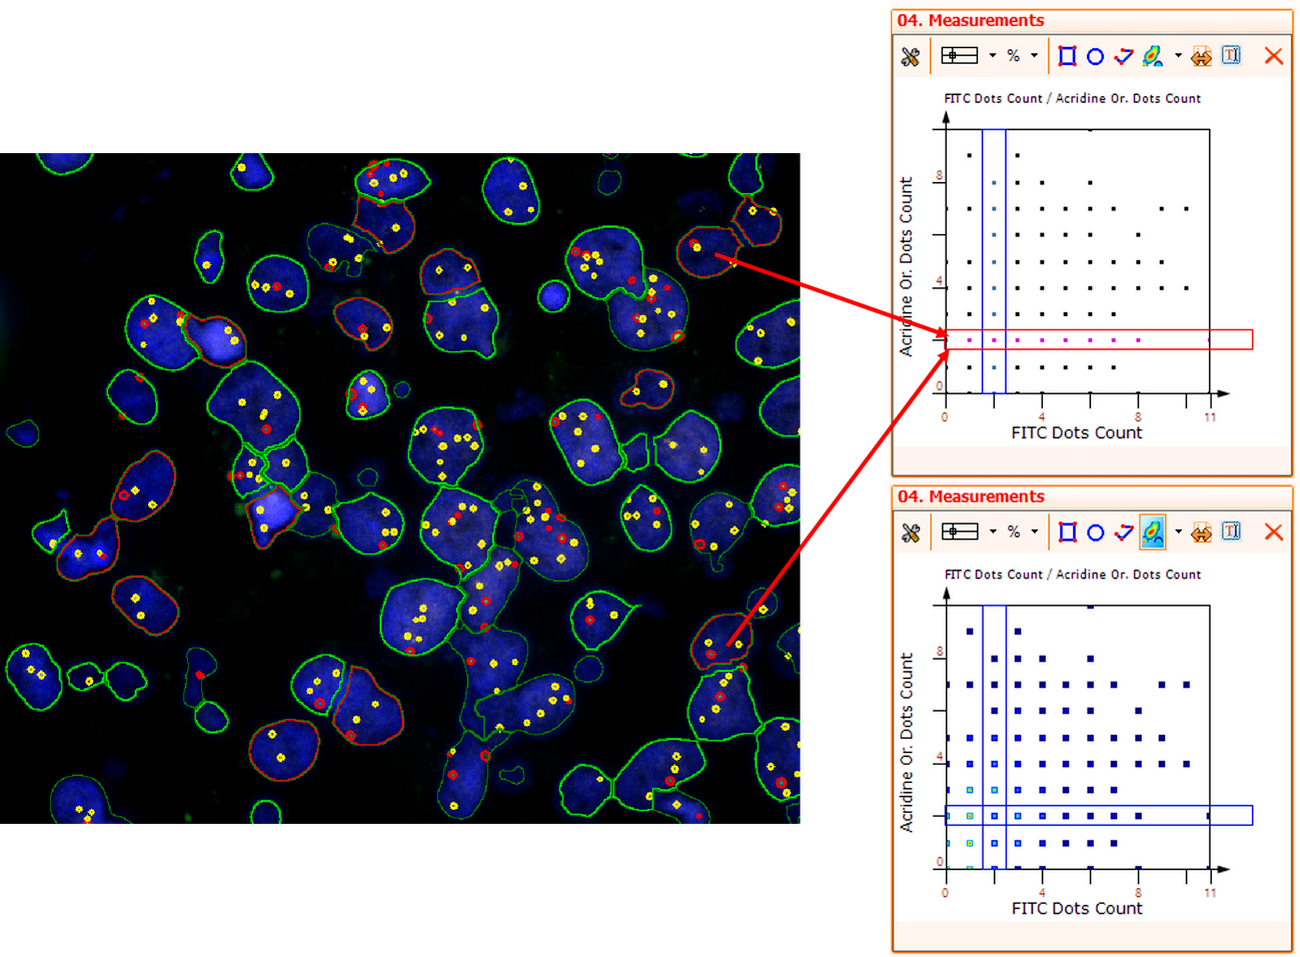
For further visualization of the analysis results, StrataQuest outputs the data in scattergrams. In the example below, the number of Acridine dots per nucleus (y-axis) is plotted against the FITC dots per nucleus (x-axis). The identified nuclei were gated for the condition “2 acridine dots per nuclei”, where the number of FITC dots can vary, and selected cells are shown in red contour via backward connection. Scattergrams showing the number of detected nuclei with each dot number combination are useful, especially with the Heat Map function enabled (bottom) which indicates those groups with a higher quantity of nuclei. To gain quantitative data for statistical analysis, the results can be immediately exported to Excel, CSV, and PDF formats.


IF Dots 2 min

FISH analysis is only one example of StrataQuest´s capabilities. If you are interested in how StrataQuest streamlined image analysis solution can enhance your research today, please reach out to a TissueGnostics team member for a demonstration.

Get to know more about FISH applications combined with TissueGnostics solutions in our blog posts:

Tissue Detection Technology, Autofocus, Image Stitching & Illumination Correction

TissueFAXS software in all configurations provides comprehensive and robust automatic tissue detection. To take into account the wide variety of stainings and staining quality as well as the placement and size of tissue sections on the slide the algorithm providing tissue detection has controls for adaptation if needed. There are also drawing tools to add to or subtract from the automatic result to further fine tune. If the user does not need an automatic detection of the whole tissue and prefers to identify specific parts of the tissue visually there also are comprehensive drawing tools to set such regions up for scanning.

Tissue Detection 2017

TissueFAXS systems operate with software autofocus. There are two methods, the focal plane or a defined area with one focus point. The focal plane method has the advantage of having smoother focus transitions between its focal points. The graphic on the right illustrates the focal plane with a simplified virtual overlay. The focal points are shown as small flags. TissueFAXS software also stitches the single field of view images of a sample into a seamless digital slide which is visualised in the softwares. Illumination correction (also known as "vignetting" or "flat field" correction) is available both in brightfield and in fluorescence modes.

TissueFAXS scanning speed

TissueFAXS scanning speed is high for automated microscopy. This is supported on the hardware side by cost-efficient, good quality, fast cameras with large sensors, corresponding llumination systems and SSD drives to rapidly store the images. The TissueFAXS software is permanently optimized to integrate these often changing hardware devices.

The images below exemplify scanning speeds in brightfield and epifluorescence. 

1cm2 fluo        1cm2 fluo


Tissue Microarray Imaging

TissueFAXS provides a specialised version of the Tissue Detection algorithm for Tissue Microarray (TMA) scanning. This algorithm recognises TMA blocks on the TMA slide provided that the alleys between the blocks are large enough. Within each recognised TMA block the algorithm also recognises the logical block structure, i.e. how many rows and columns there are in the block. Based on this the algorithm puts placeholders core markers for missing or damaged cores into the block detection. These crosshatched markers will not be scanned, they only serve to keep the nomenclature of the cores intact. Blocks can be moved as a whole, scaled in the x and y axes and rotated. Core markers can be moved and resized either individually, in selected groups or for the whole block.

The images below show some of these operations.

 resize tma cores      resize tma cores     resize tma cores


DAPI 3 layers

Z-STACKING & FISH IMAGING 

TissueFAXS also offers Extended Focus scanning (also known as focus stacking, focal plane merging, z-stacking or focus blending) and z-stacks. In this method, a series of images above and/or below the actual focal plane of each field of view are scanned in addition. For each image or channel image this "image stack" is then compressed into one image containing all the areas in focus of the whole image stack, resulting in an optimal image.

This method is e.g. essential for FISH analysis as it ensures that no FISH probe above and beneath the actual focal plane is missed. The z-stack images can optionally be saved to be used in 3D reconstruction. 


Cell Culture Vessel Imaging

TissueFAXS also has a dedicated scanning mode for microtiter plates. The most commonly used plate types are stored as templates in the software and can be activated as required. The well regions are then automatically established in the right place for scanning (first image shown below). There also is an inbuilt editor for creating more microtiter plate templates. The well regions are also automatically named. Whole well areas or groups thereof can be resized and moved. There is also an option to draw subregions in a well region (rectangular, spherical or polygonal)  and then propagate these into all or a selection of the other well regions. The well regions or their subregions can be scanned and the scans results can then be passed on to TG analysis software to be analysed.

Whole well analysis        Whole well analysis        Whole well analysis


High-throughput

TissueFAXS software is also used to scan with the TissueFAXS SL high throughput system in a special configuration allowing the control and management of the 60 two-slide frames (in total 120 slides) in the magazine of the system.


Contact

TissueGnostics GmbH
Taborstraße 10/2/8
1020 Vienna, Austria
+43 1 216 11 90
This email address is being protected from spambots. You need JavaScript enabled to view it.

We use cookies on our website. Some of them are essential for the operation of the site, while others help us to improve this site and the user experience (tracking cookies).
You can decide for yourself whether you want to allow cookies or not. Please note that if you reject them, you may not be able to use all the functionalities of the site.