• 1

WELCOME

TissueGnostics provides fully integrated cutting-edge tissue cytometers for (i) whole-slide imaging (brightfield, fluorescence, confocal, multispectral) and (ii) high-end analysis of tissue sections, cultured cells, TMAs, smears etc. Explore TGs solutions for spatial phenotyping, single cell analysis, molecular single cell profiling, machine-learning based tissue classification and many more.
 

IHC Immune Status in situ APP: CD3+ cells in epithelial and interstitial tissues

The aim of the project was to quantify the distribution of CD3+ cells in and around the epithelial areas of prostate biopsies from a clinical study. The biopsies were provided by the Medical University of Vienna. The following images show some of the analysis steps.

  AntiCD3 TissueDetection

The first step in the APP is Tissue Detection.
AntiCD3 TissueDetection

In a second step a composite image of both brown and blue channels is created.
AntiCD3 TissueDetection

Then, a density map of the nuclei is built to determine areas with denser and larger nuclei (epithelial area candidates). 
AntiCD3 TissueDetection

Based on the density map the epithelial areas are detected and cleaned.
AntiCD3 TissueDetection

Finally, distance ranges are projected from the perimeters of the epithelial areas to provide distance measurements for CD3+ cells.
AntiCD3 TissueDetection

Detailed View

The three detailed view images below show the detection of nuclei and CD3+ staining.
AntiCD3 TissueDetection

IF COEXPRESSION APP

IHC 2 APP: Ki-67 nuclear staining analysis

Ki-67 staining and evaluation is an integral part of cancer diagnosis. Despite it being routinely used in pathology there still are issues to its correct use. Automated tissue analysis can provide a valuable supplement to visual evaluation. The IHC2 APP is among the StrataQuest easiest to use APPs and requires very little preparation time.

The first step of brightfield analysis is a color separation. Hematoxylin (blue) and Ki-67 (brown) stain are shown in separated grayscale images.

Ki 67 orig Ki 67 Hema ColSep

The nuclear segmentation algorithm is used on the nuclei, stained in hematoxylin and Ki-67. A virtual channel can be used for data from both stains.

Ki 67 orig Ki 67 NucSeg Orig

Backward gating provides visual control of the correctness of the nuclear segmentation. This can be visualized both on the orginal and grayscale images.

Ki 67 BG Orig Ki 67 BG Ki 67Gray

IF Dots APP: FISH

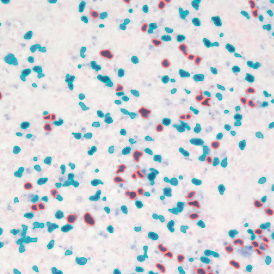
This example shows how the IF Dots APP can be applied to FISH evaluations. The APP can also be applied to any analysis of dot sized objects, in conjunction with all other StrataQuest features. For FISH evaluation the recommended workflow is to run the dot algorithm on all dot stainings and the to select suitable nuclei by their large size and high compactness.

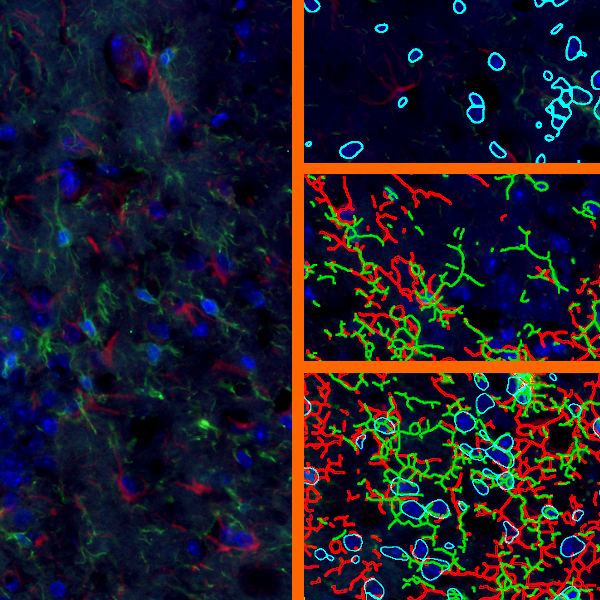
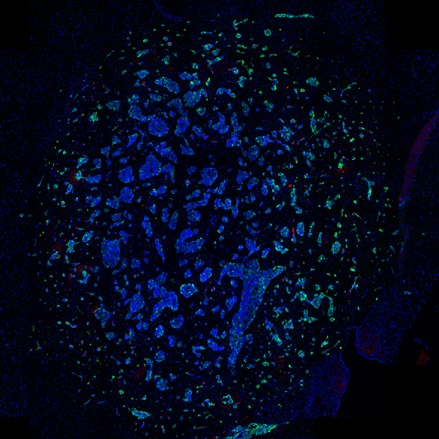
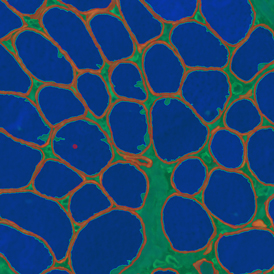
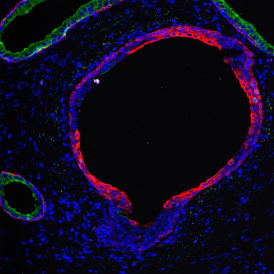
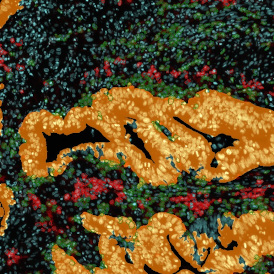
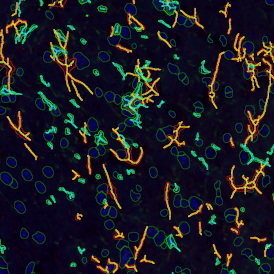
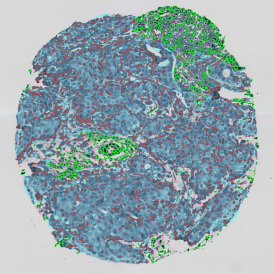
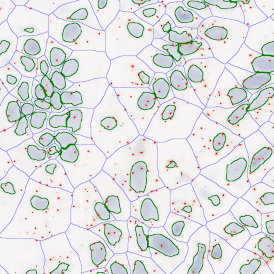
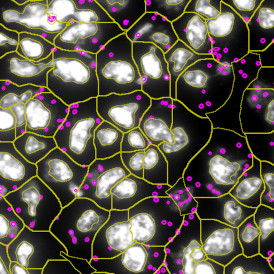
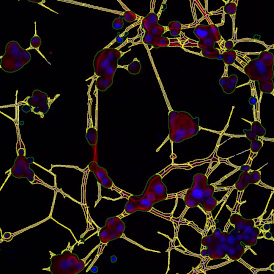
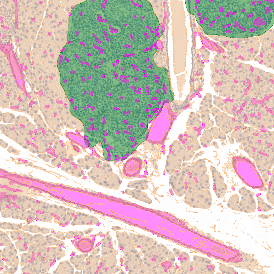
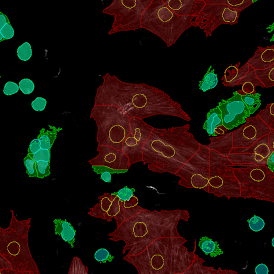
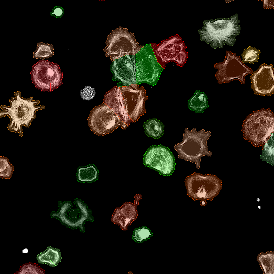
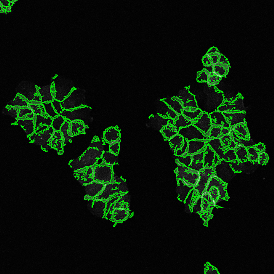
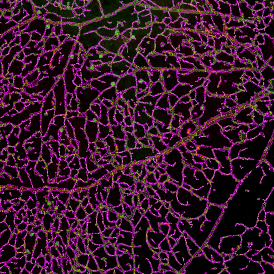
Overview of triple staining showing the nucleus in DAPI (blue), the housekeeping gene (green) and HER2/neu (red).

FISH 01 LargeComp FISH 01 LargeComp

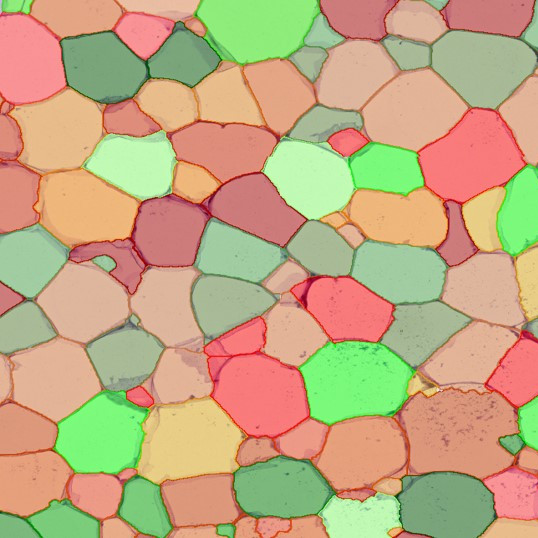
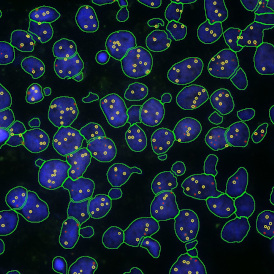
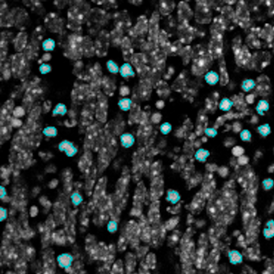
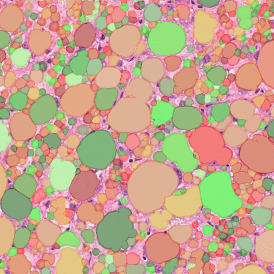
Selection of suitable nuclei by size and compactness.
FISH 01 LargeComp FISH 01 LargeComp

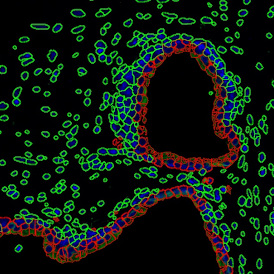
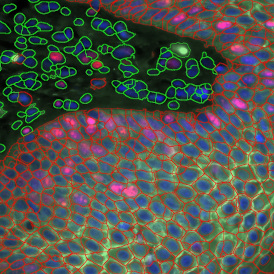
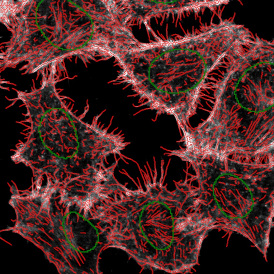
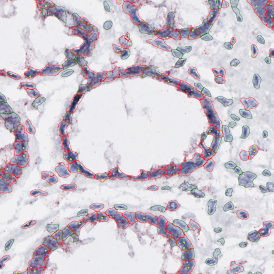
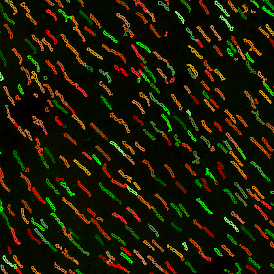
Detection of green housekeeping gene signal is shown in yellow in the right image and the detection of red HER2/neu signal in yellow in the left image.

FISH 01 LargeComp FISH 01 LargeComp

Cells with a 3 to 2 dots ratio (only one in this image) are shown by backward gating from the "3 x 2" gate.

FISH 01 LargeComp


FISH dot can be displayed and exported in two ways, as shown below. Scattergrams showing the number of cells with each dot number combination is useful, especially with the Heat Map function enabled which shows those groups with more cells. For the immediate export of data for pathology applications a special table view showing 16 parameters is provided (shown partially on the right side) which offers export to Excel, CSV and PDF formats.

FISH 01 LargeComp FISH 01 LargeComp


IHC Immune Status in situ APP: Tumor immunology

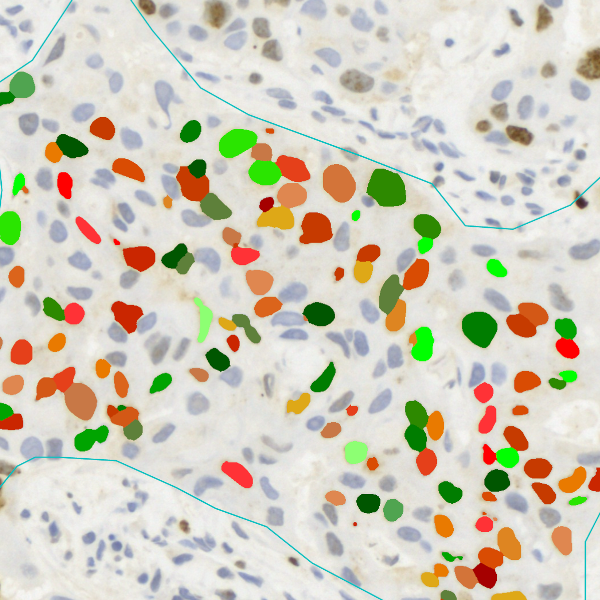
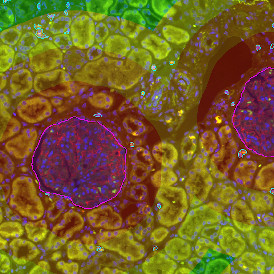
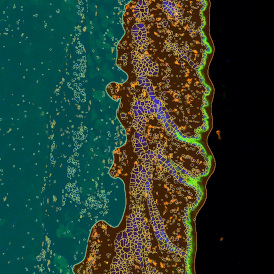
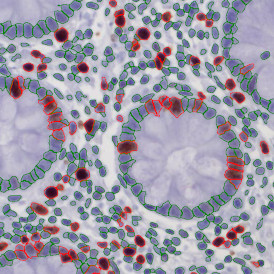
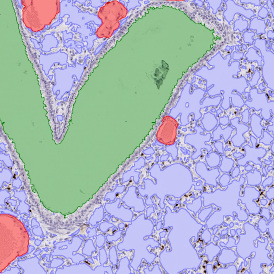
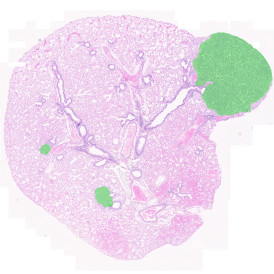
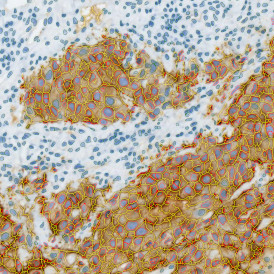
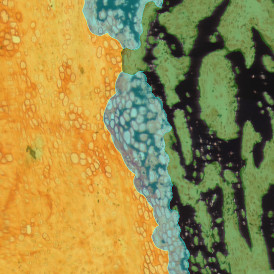
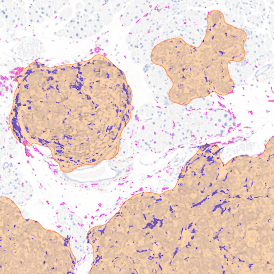
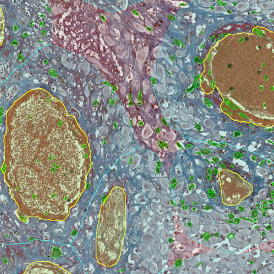
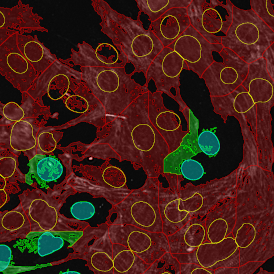
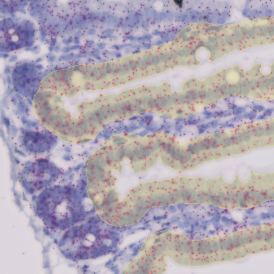
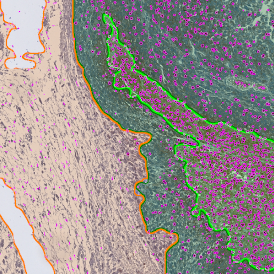
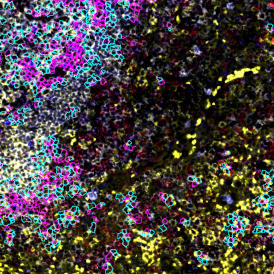
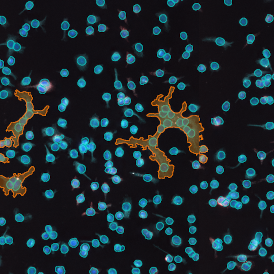
The IHC Immune Status in situ APP is ideally suited for immunological investigations due to its capability to measure the distance of single cells from tissue metastructures. In this example this is applied to bladder cancer  Tissue Microarrays (TMA). In this TMA core DAB stained CD3+ lymphocytes (brown) are evaluted in the context of their distance from automatically detected tumor regions as well as from large and small lymphocyte clusters.

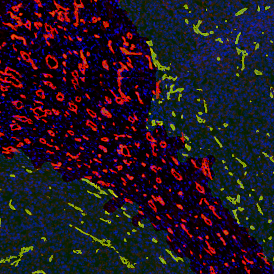
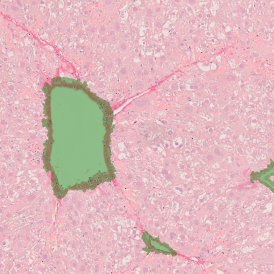
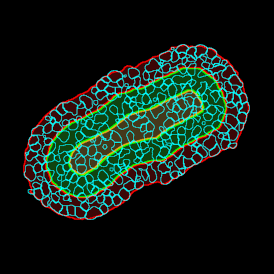
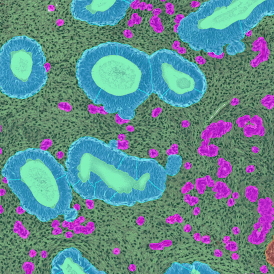
TMA core with tumor detection and tumor proximity ranges

Bladder 01 ClustProx Bladder 01 ClustProx

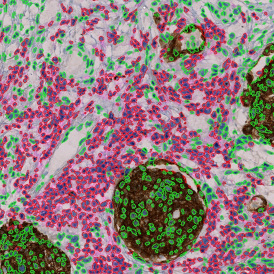
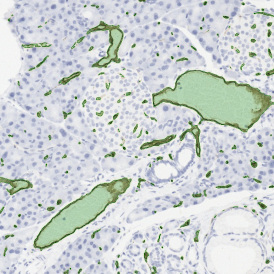
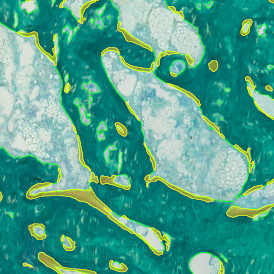
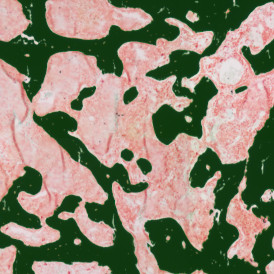
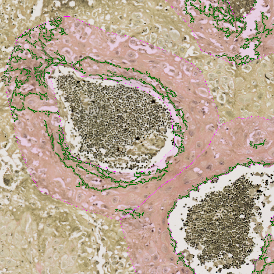
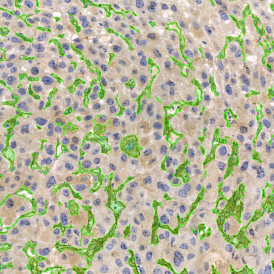
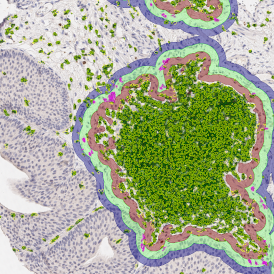
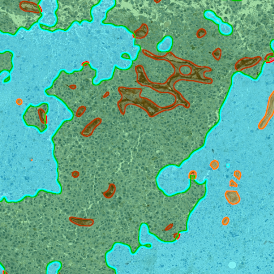
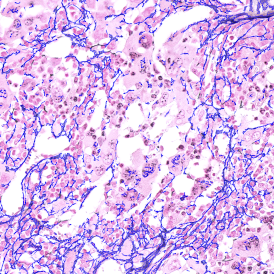
TMA core with lymphocyte cluster detection and lymphocyte cluster proximity ranges
Bladder 01 ClustProx Bladder 01 ClustProx

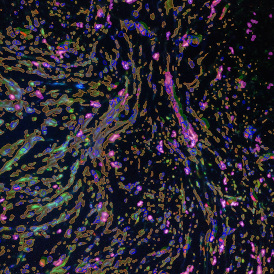
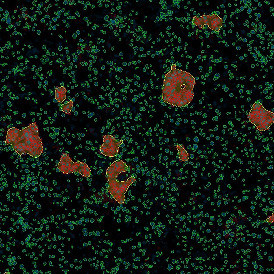
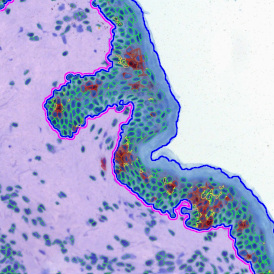
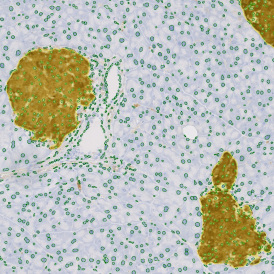
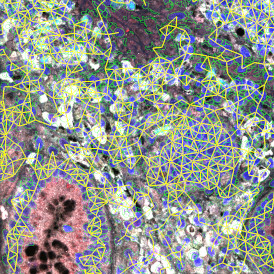
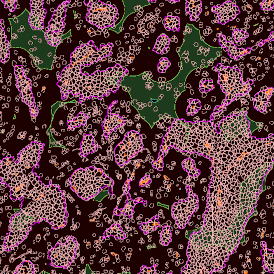
Lymphocytes (CD3+, purple contour) within tumor proximity
Bladder 01 ClustProx Bladder 01 ClustProx

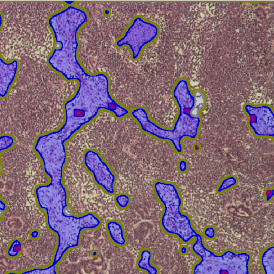
Lymphocytes (CD3+, purple contour) within lymphocyte cluster proximity
Bladder 01 ClustProx Bladder 01 ClustProx

Sample courtesy of Dr. Kathleen Williamson, Centre for Cancer Research and Cell Biology, Queen’s University, Belfast

IF COEXPRESSION APP

Distance of tumor cells from blood vessels

The following example was analysed using the IF Tumor Foci Angio App. It was done for the Johns Hopkins Hospital in New York. The aim was to evaluate the distance of tumor cells from blood vessels within the tumor cell clusters.

Tumor areas are detected using cytokeratin+ cells (green) and cell density. Blood vessels are detected using CD31cells (red). The distance of tumor cells from blood vessels within the tumor areas can then be measured. Some basic steps of the analysis are shown below. Final result: Number of tumor cells within each distance range of a blood vessel: 0-50 μm: 6.988/52%; 50-100 μm: 3.483/26%; 100-150 μm: 1.845/14%

brain tumor digital slaide

Brain tumor whole digital slide


Brain tumor slide

IF COEXPRESSION APP

IHC Membrane APP: HER2/neu in Breast Cancer

Within this project the aim was to measure the prominent diagnostic parameter for breast cancer, the intensity of the HER2/neu membrane staining and the completeness of the closure of the respective membrane rings. The biopsies were provided by the Medical University of Vienna.

Backward Gating for all cells showing

The following images show some results of steps in the automated analysis process.

Result of automated color separation for HER2/neu staining

Colour sep orig 1

HER2/neu membrane detection algorithm results

 Colour sep orig 1Colour sep orig 1

Automatic nuclear segmentation algorithm results

Colour sep orig 1Colour sep orig 1

Tumor nuclei selected (red contour vs. green) in strong HER2/neu areas

Colour sep orig 1Colour sep orig 1

Low angle of HER2/neu staining, low intensity

Colour sep orig 1Colour sep orig 1

High angle of HER2/neu staining, high intensity
Colour sep orig 1Colour sep orig 1


IF COEXPRESSION APP

Analysis of cyclic stain and bleach samples

Multi-epitope ligand cartography (MELC) is a technology using samples subjected to cycles of fluorescent staining, imaging and photobleaching. Each cycle can use an antibody for a different protein. The result is a set of images of the distributions of many proteins for the same samples.

Tumor areas are detected using cytokeratin+ cells and their density. Blood vessels are detected using CD31+ cells. The distance of tumor cells from blood vessels within the tumor areas can then be measured. A specialized APP was established to analyse a MELC sample of skin from a melanoma patient. The aim was to quantify the expression of 90 proteins in close proximity to Melan-A positive areas. Some of the resulting images are shown below. StrataQuest is ideal to fully address the immense potential of such samples with automated context analysis. 

quantifiedantigensfull

The possibilities of the combination of cyclic stain-bleach methods and StrataQuest context-based analysis are almost endless. Which protein increases in its expression density and which one decreases in relation to its distance to:

  • Normal melanocytes,
  • Melanoma cells,
  • Blood vessels,
  • Inflammation sites,
  • Sweat glands,
  • Hair follicles,
  • Basal membrane,
  • Langerhans cells,
  • Intraepithelial T-cells,
  • Regulatory T-cells
  • ...
IF COEXPRESSION APP

Leishmaniasis APP: Leishmaniasis parasite detection & analysis in cell culture and tissue

The APP was designed to assist in immunology research into Leishmaniasis and can be adapted for research on other intracellular parasites. It can be used both on cell cultures and tissue sections. Its main function is to automatically detect parasite stages in cell compartments and quantify them in context with specific immune markers. The parasite load and the status of parasite stages, e.g. “live/dead” can also be evaluated and all results can be output.

Cell detection with specific live/dead parasite stage combinations
cellculturelabeled cellculturelabeled

Mouse skin-draining lymph node stained with DAPI (nucelus, blue) and resulting epithelial area detection
cellculturelabeled cellculturelabeled


  • TG AUSTRIA
    Global Headquarter

    Taborstrasse 10/2/8
    A-1020 Vienna
    AUSTRIA, EU

    Tel.: +43/1/216 11 90

    This email address is being protected from spambots. You need JavaScript enabled to view it.


    TG ROMANIA

    Str. Sf. Andrei, nr.15A
    700028 Iasi
    ROMANIA, EU

    Tel.: +40/332/40 58 66

    This email address is being protected from spambots. You need JavaScript enabled to view it.

    Read More
  • TG USA 

    12522 Moorpark Street
    Suite #106
    Los Angeles, CA 91604
    USA

    Tel.: +1/818/856/8056

    This email address is being protected from spambots. You need JavaScript enabled to view it.


    TG USA East

    ScientiaLux d.b.a.
    4 Farnum Terrace
    Worcester, MA 01602
    USA

    Tel.: +1/508/471/7732

    This email address is being protected from spambots. You need JavaScript enabled to view it.

    Read More
  • TG ASIA PACIFIC

    China Division
    Room 506,
    No.6 Auto Museum East Rd,
    Fengtai District Beijing
    CHINA

    Tel.: +86/400/898 1980

    This email address is being protected from spambots. You need JavaScript enabled to view it.


    Western Pacific Division
    Taipei

    Tel.: +886/928/899 397

    This email address is being protected from spambots. You need JavaScript enabled to view it.


    Australia Division
    Brisbane, Queensland

    Tel.: +61/416 037 618

    This email address is being protected from spambots. You need JavaScript enabled to view it.

    Read More
  • TG AFRICA

    Measuring Instruments Technology (MIT)
    CSIR Campus, Building 33
    Meiring Naude Rd
    Brummeria, Pretoria 0181
    SOUTH AFRICA

    Tel.: +27 12 349 5191
    Cell: +27 82 784 2011

    This email address is being protected from spambots. You need JavaScript enabled to view it.

    Read More
  • 1

Contact

TissueGnostics GmbH
Taborstraße 10/2/8
1020 Vienna, Austria
+43 1 216 11 90
This email address is being protected from spambots. You need JavaScript enabled to view it.

We use cookies on our website. Some of them are essential for the operation of the site, while others help us to improve this site and the user experience (tracking cookies).
You can decide for yourself whether you want to allow cookies or not. Please note that if you reject them, you may not be able to use all the functionalities of the site.